

Question: Copter Assembly Flight Flight Time Flight Assembly 1 1 1.00 1 1 2 1.03 0 1 3 0.83 0 1 4 1.16 2 1 5
Copter Assembly Flight Flight Time Flight Assembly 1 1 1.00 1 1 2 1.03 0 1 3 0.83 0 1 4 1.16 2 1 5 1.13 3 1 6 1.15 3 1 7 1.13 1 1 8 1.13 2 2 9 1.00 0 2 10 0.96 1 2 11 0.98 0 2 12 0.93 1 2 13 1.06 2 2 14 0.95 1 2 15 0.98 0 2 16 1.00 2 3 17 1.21 0 3 18 1.13 1 3 19 1.16 3 3 20 1.25 2 3 21 1.16 1 3 22 1.23 0 3 23 1.11 2 3 24 1.33 2
0 = Strongly inaccurate
1 = Somewhat inaccurate
2 = Somewhat accurate
3 = Strongly accurate
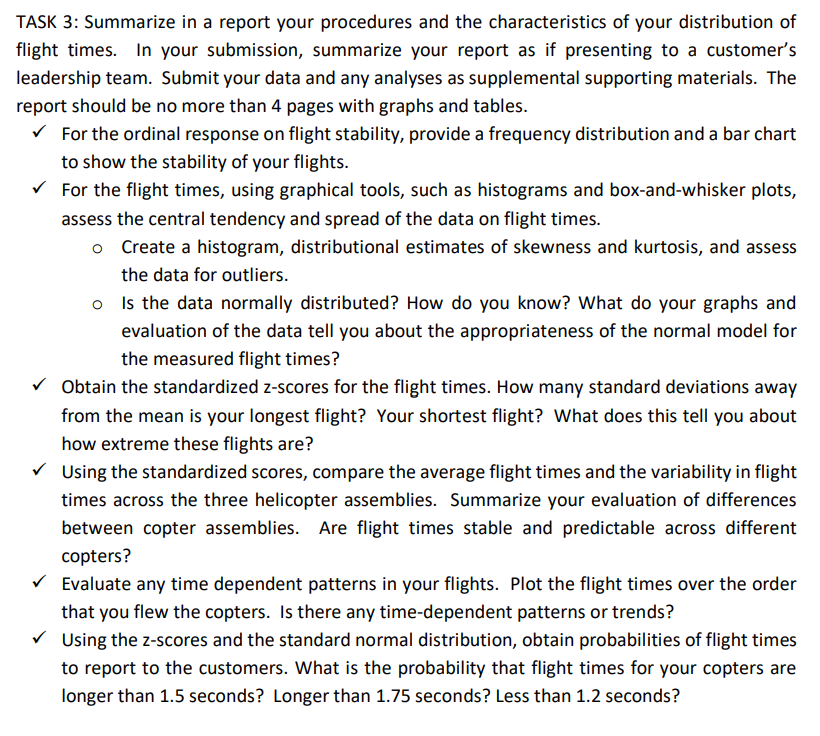
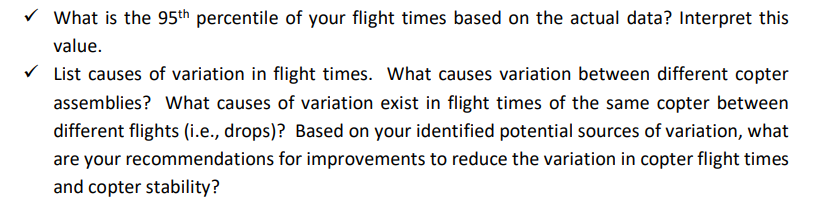
TASK 3: Summarize in a report your procedures and the characteristics of your distribution of flight times. In your submission, summarize your report as if presenting to a customer's leadership team. Submit your data and any analyses as supplemental supporting materials. The report should be no more than 4 pages with graphs and tables. v' v' For the ordinal response on flight stability, provide a frequency distribution and a bar chart to show the stability of your flights. For the flight times, using graphical tools, such as histograms and box-and-whisker plots, assess the central tendenCy and spread of the data on flight times. o Create a histogram, distributional estimates of skewness and kurtosis, and assess the data for outliers. o Is the data normally distributed? How do you know? What do your graphs and evaluation of the data tell you about the appropriateness of the normal model for the measured flight times? Obtain the standardized z-scores for the flight times. How many standard deviations away from the mean is your longest flight? Your shortest flight? What does this tell you about how extreme these flights are? Using the standardized scores, compare the average flight times and the variability in flight times across the three helicopter assemblies. Summarize your evaluation of differences between copter assemblies. Are flight times stable and predictable across different copters? Evaluate any time dependent patterns in your flights. Plot the flight times over the order that you flew the copters. Is there any time-dependent patterns or trends? Using the z-scores and the standard normal distribution, obtain probabilities of flight times to report to the customers. What is the probability that flight times for your copters are longer than 1.5 seconds? Longer than 1.?5 seconds? Less than 1.2 seconds? v' v' What is the 95th percentile of your flight times based on the actual data? Interpret this value. List causes of variation in flight times. What causes variation between different copter assemblies? What causes of variation exist in flight times of the same copter between different flights (i.e., drops]? Based on your identified potential sources of variation, what are your recommendations for improvements to reduce the variation in copter flight times and copter stability
Step by Step Solution
There are 3 Steps involved in it

Get step-by-step solutions from verified subject matter experts