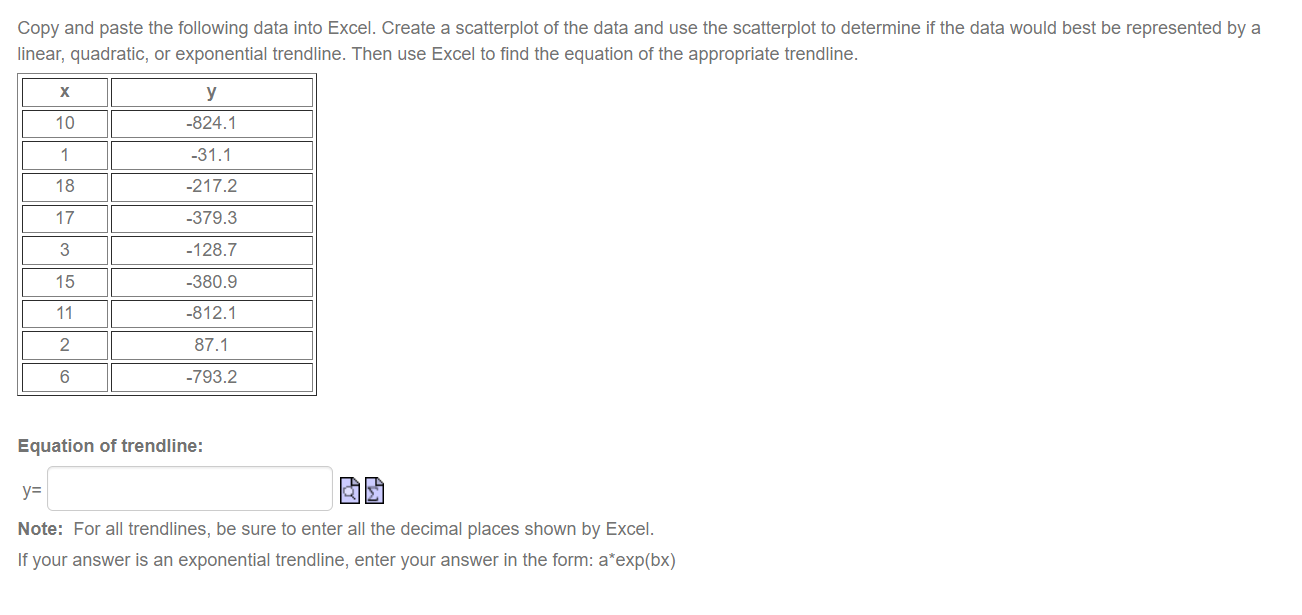
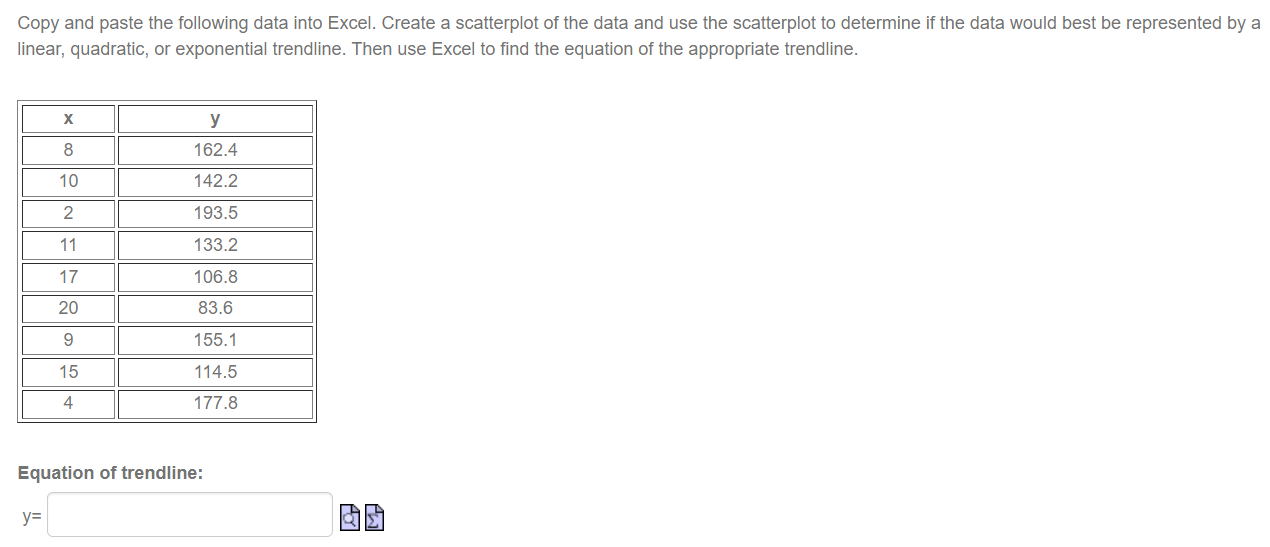
Question: Copy and paste the following data into Excel. Create a scatterplot of the data and use the scatterplot to determine if the data would best

Copy and paste the following data into Excel.Copy and paste the following data into Excel.Copy and paste the following data into Excel.Copy and paste the following data into Excel.Copy and paste the following data into Excel.
Copy and paste the following data into Excel. Create a scatterplot of the data and use the scatterplot to determine if the data would best be represented by a linear, quadratic, or exponential trendline. Then use Excel to find the equation of the appropriate trendline. X y 10 -824.1 1 -31.1 18 -217.2 17 -379.3 3 -128.7 15 -380.9 11 -812.1 2 87.1 6 -793.2 Equation of trendline: y= Note: For all trendlines, be sure to enter all the decimal places shown by Excel. If your answer is an exponential trendline, enter your answer in the form: a*exp(bx)Copy and paste the following data into Excel. Create a scatterplot of the data and use the scatterplot to determine if the data would best be represented by a linear, quadratic, or exponential trendline. Then use Excel to find the equation of the appropriate trendline. X y 8 162.4 10 142.2 2 193.5 11 133.2 17 106.8 20 83.6 9 155.1 15 114.5 4 177.8 Equation of trendline: y=The teacher created the following two scatterplots of this data, along with the linear trendline. Final Grade vs Midterm Grade Final Grade vs Class Project Grade 100 100 90 90 80 80 70 70 60 2...... y = 1,0036x - 0.7 60 y = 0.433x + 51.145 Final Grade 50 50 8 40 30 30 20 10 10 0 0 50 55 60 65 70 75 8O 85 90 95 100 50 55 60 65 70 75 80 85 90 95 100 Midterm Grade Class Project Looking at the two scatterplots, which variable better predicts final grades? O Midterm Grades O Class Projects If a student scored 66% on the midterm grade, what is their predicted final grade? Hint: use the trendline equation to evaluate. Number (Round to two decimal places.) If a student scored 66% on the class project, what is their predicted final grade? Hint: use the trendline equation to evaluate. NumberThe following table shows the grip strength of women compared to their age. Using the given data, create a scatterplot and choose the best trendline to answer the following questions. Age Grip Strength 15 65 16 60 28 58 61 60 53 46 43 66 16 56 25 75 28 46 34 45 37 58 41 70 43 73 49 45 53 60 61 56 68 30Which type of trendline best ts this data? C) Linear O Quadratic O Exponential What is the trendline for this data? y: l ill-Is (Include all the decimal places given in Excel) If you were a physical therapist and had a client who was 55 years old what would her expected grip strength be? \" Number ' (Round to two decimal places) What would the expected grip strength be for a client who was 10 years older (65 years old)? ' Number ' (Round to two decimal places) By how much do we expect a woman's grip strength to increase or decrease between age 55 and age 65? ' Number ' (Answer with a negative number if her strength decreased. Answer with a positive number if her strength increased)

Step by Step Solution

There are 3 Steps involved in it

1 Expert Approved Answer
Step: 1 Unlock blur-text-image
Question Has Been Solved by an Expert!

Get step-by-step solutions from verified subject matter experts

Step: 2 Unlock
Step: 3 Unlock

Students Have Also Explored These Related Mathematics Questions!