

Question: Copy and paste the relevant output below. If you are doing the calculations by hand, show your work here (how you found the standard error,

Copy and paste the relevant output below. If you are doing the calculations by hand, show your work here (how you found the standard error, t statistic, and degrees of freedom):
- Report the value of t, the degrees of freedom (df), and the P value that the software reports:
t statistic =
degrees of freedom =
P value =
Significance test for a mean with review of confidence interval for a mean
Statistical analysis applications
You can use the Art of Stats applications at https://artofstat.com/web-apps
- Describing and exploring quantitative data https://istats.shinyapps.io/EDA_quantitative/
- Inference for a mean https://istats.shinyapps.io/Inference_mean/
- The t distribution https://istats.shinyapps.io/tdist/
Information for homework 4:
Use the data from the 2018 General Social Survey. The raw data are in the filegss_2018_tvhours.txt; a frequency distribution of the variable is in the filegss_2018_tvhours.xls; and the data are available in the Art of Stat app Inference for a Population mean as Data From Textbook, and the Dataset TV Hours. The data are a random sample from the adult population in the US.
Variable
Hours watching TV each day TVHOURS
Survey question: On the average day, about how many hours do you personally watch television?
Descriptive statistics calculated at https://istats.shinyapps.io/Inference_mean/
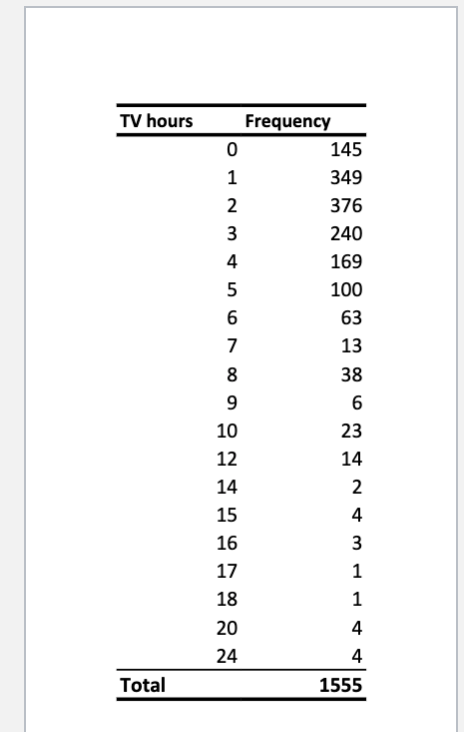
TV hours Frequency 145 349 376 240 169 ODO NO UI A W N H O LOO 63 13 38 6 23 12 14 15 16 AHHWAND 17 18 20 24 Total 1555
Step by Step Solution
There are 3 Steps involved in it

Get step-by-step solutions from verified subject matter experts