

Question: Copy the dot plot shown, and group the data into four quartiles. Draw the box plot that corresponds to the dot plot below.
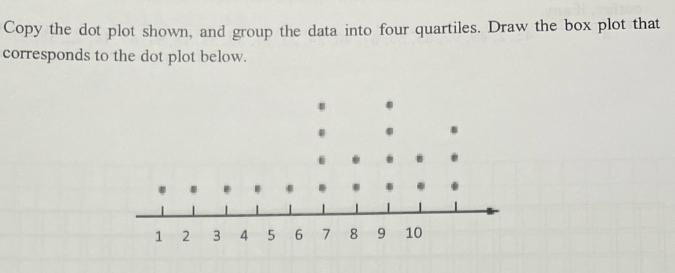
Copy the dot plot shown, and group the data into four quartiles. Draw the box plot that corresponds to the dot plot below. " 1 2 3 4 5 6 7 8 9 10 "
Step by Step Solution
There are 3 Steps involved in it
1 Expert Approved Answer
Step: 1 Unlock

Question Has Been Solved by an Expert!
Get step-by-step solutions from verified subject matter experts
Step: 2 Unlock
Step: 3 Unlock