

Question: Copy the supply and demand graph onto your notes. Then, using the data in the chart, draw a new demand curve on the graph. CUPS
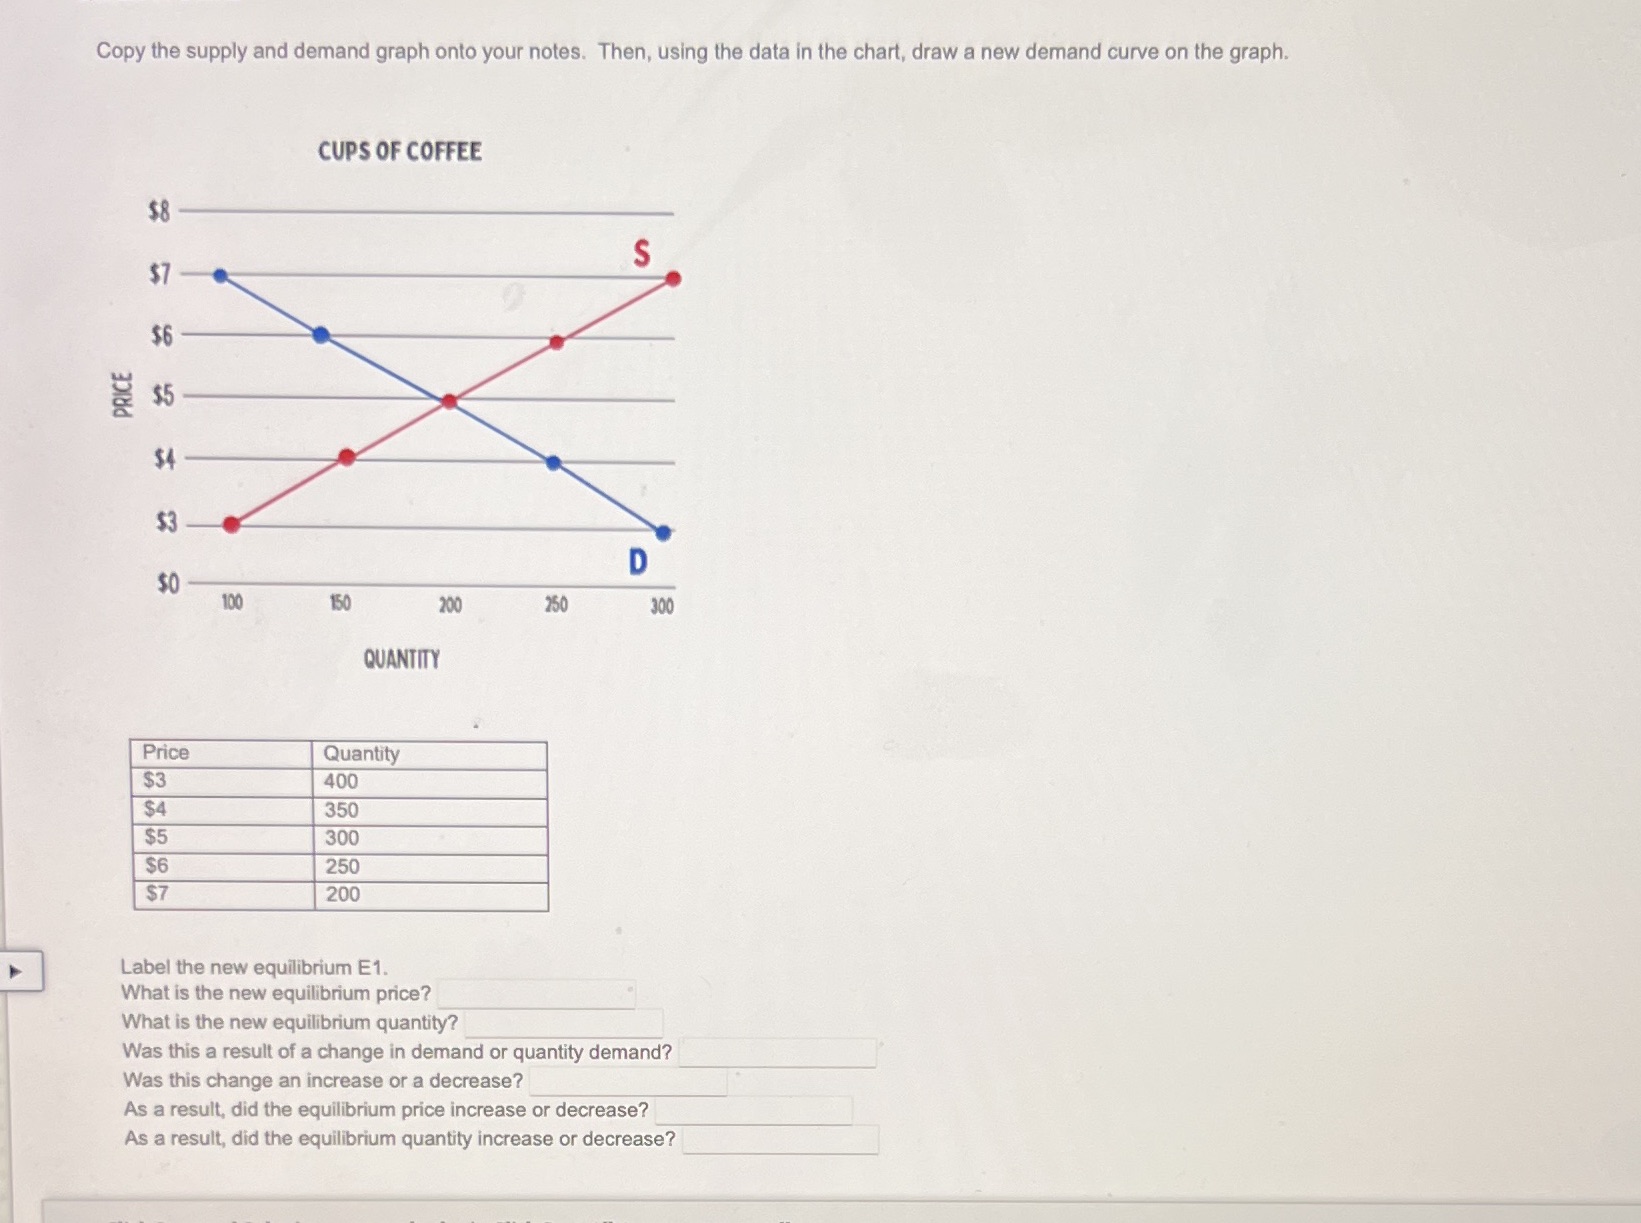
Copy the supply and demand graph onto your notes. Then, using the data in the chart, draw a new demand curve on the graph. CUPS OF COFFEE $8 S $6 PRICE $5 $3 D $0 100 150 200 250 300 QUANTITY Price Quantity $3 400 $4 350 $5 300 $6 250 $7 200 Label the new equilibrium E1. What is the new equilibrium price? What is the new equilibrium quantity? Was this a result of a change in demand or quantity demand? Was this change an increase or a decrease? As a result, did the equilibrium price increase or decrease? As a result, did the equilibrium quantity increase or decrease
Step by Step Solution
There are 3 Steps involved in it
1 Expert Approved Answer
Step: 1 Unlock

Question Has Been Solved by an Expert!
Get step-by-step solutions from verified subject matter experts
Step: 2 Unlock
Step: 3 Unlock