

Question: Corp Fin - Wk 5 Q Search Sheet Home Insert Draw Page Layout Formulas Data Review View '+ Share ~ Arial A Wrap Text Custom
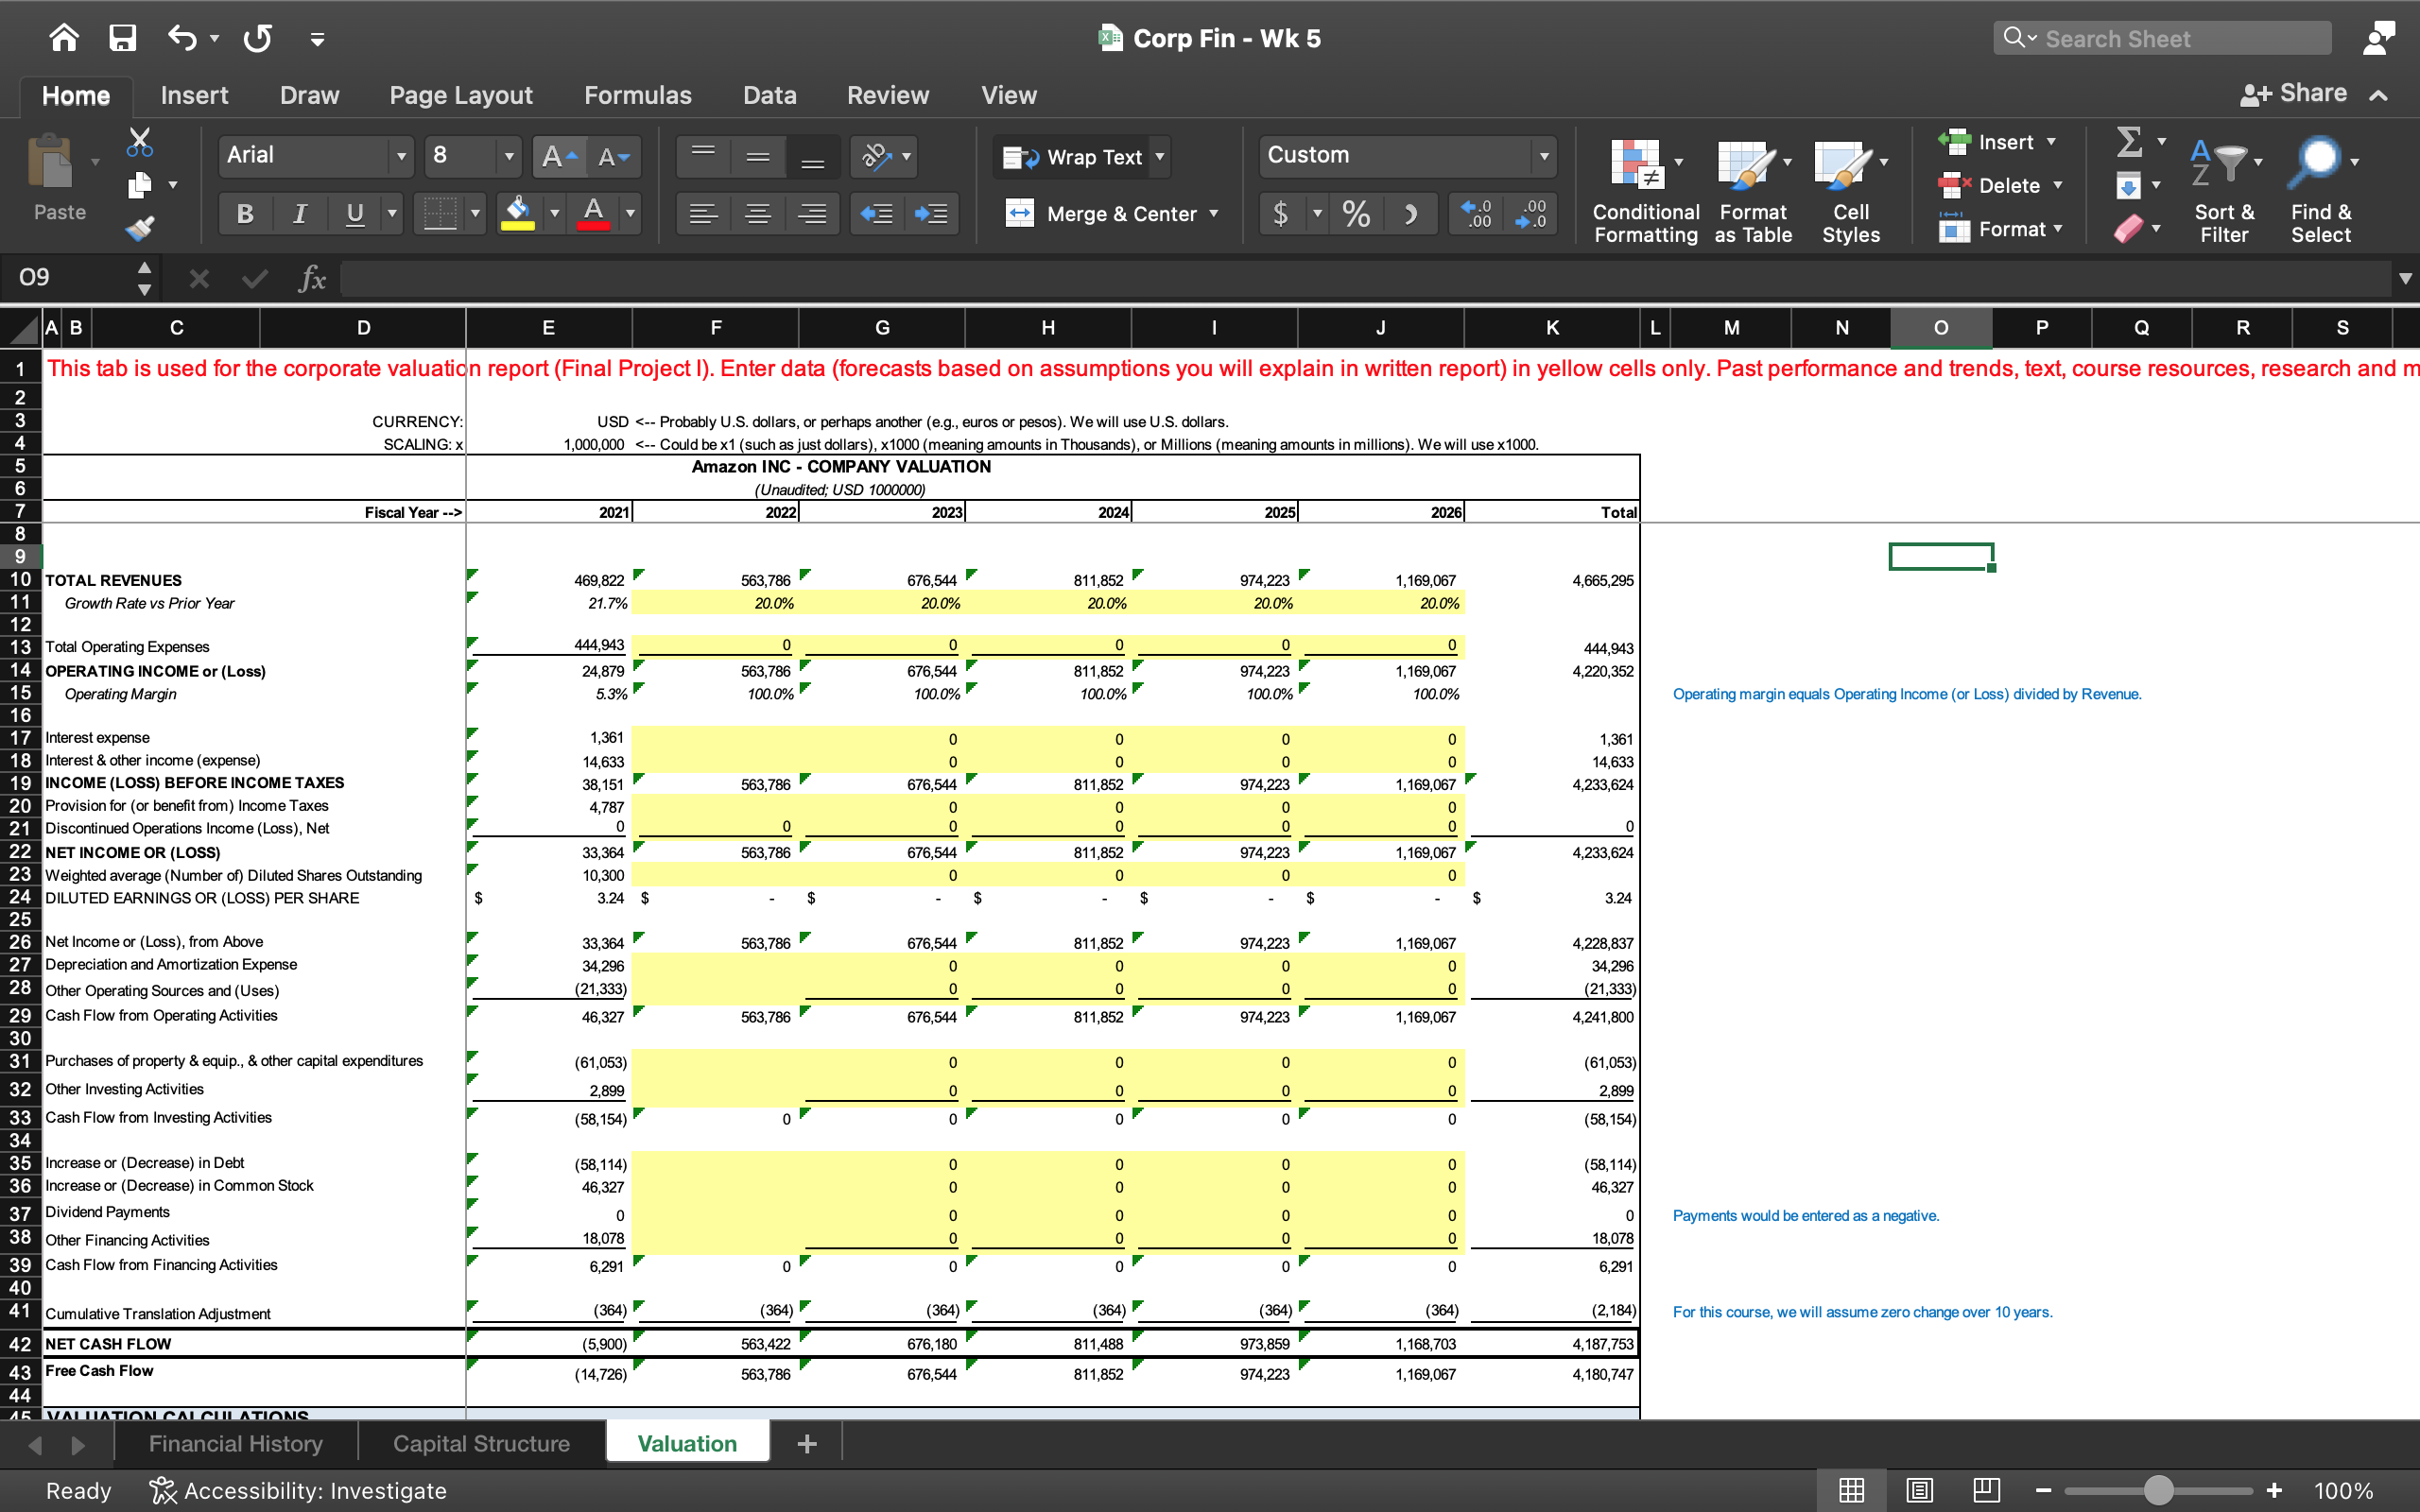
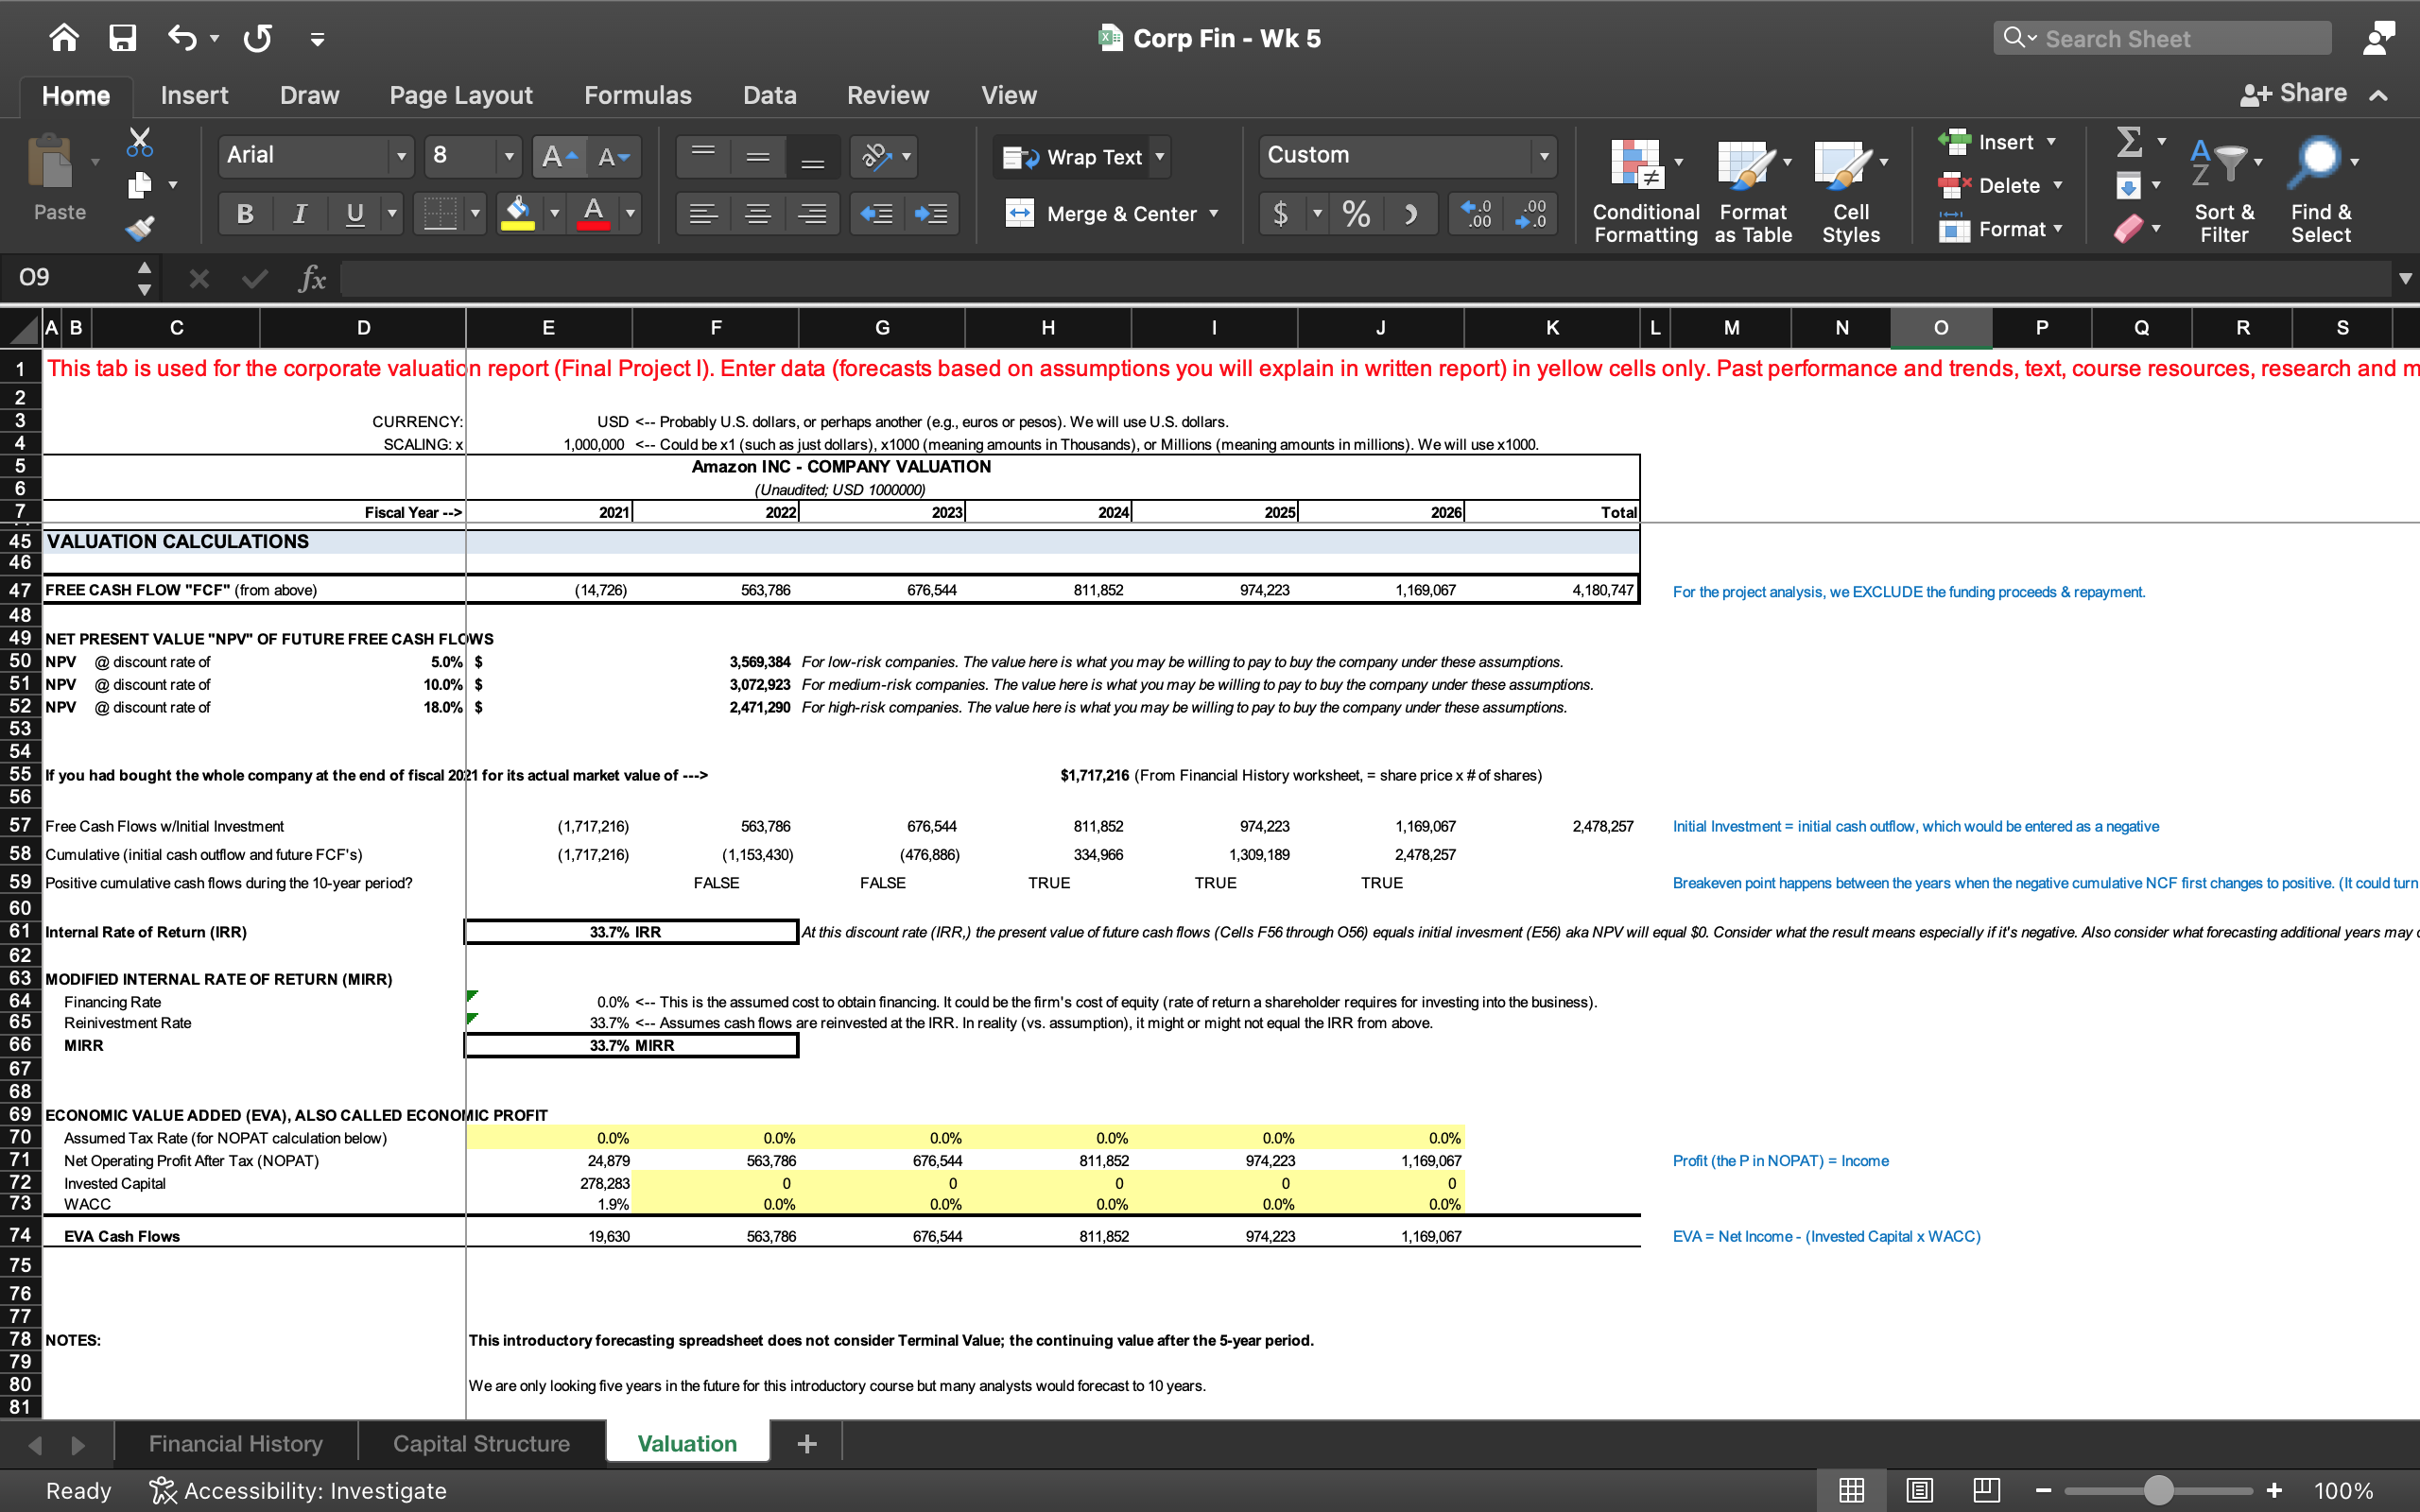
Corp Fin - Wk 5 Q Search Sheet Home Insert Draw Page Layout Formulas Data Review View '+ Share ~ Arial A Wrap Text Custom Insert A Paste B I U Delete Merge & Center $ 7 % .00 Conditional Format Cell Sort & Find & Formatting as Table Styles Format Filter Select 09 X V fx A B C D E F G H K L M N O P Q R S This tab is used for the corporate valuation report (Final Project I). Enter data (forecasts based on assumptions you will explain in written report) in yellow cells only. Past performance and trends, text, course resources, research and CURRENCY USD 2021 2022 2023 2024 2025/ 2026 Total TOTAL REVENUES 469,822 563,786 676,544 811,852 974,223 1,169,067 Growth Rate vs Prior Year 4,665,295 21.7% 20.0% 20.0% 20.0% 20.0% 20.0% Total Operating Expenses 444,943 0 144,943 OPERATING INCOME or (Loss) 24,879 563,786 676,544 11,852 974,223 1,169,067 Operating Margin 4,220,352 5.3% 100.0% 100.0% 100.0% 100.0% 100.0% Operating margin equals Operating Income (or Loss) divided by Revenue. Interest expense 1,36 Interest & other income (expense) 1,361 14,633 0 INCOME (LOSS) BEFORE INCOME TAXES 14.633 38, 151 563,786 676,544 811,852 974,223 1,169,067 20 Provision for (or benefit from) Income Taxes 4,233,624 4,787 0 Discontinued Operations Income (Loss), Net 0 loo 0 0 0 NET INCOME OR (LOSS 33,364 563,786 676,544 11,852 974,223 1,169,067 4,233,62 Weighted average (Number of) Diluted Shares Outstanding 10,300 DILUTED EARNINGS OR (LOSS) PER SHARE 3.24 $ $ 3.24 Net Income or (Loss), from Above 33,364 563,786 676,544 811,852 974,223 27 Depreciation and Amortization Expense 1,169,067 1,228,837 34,296 C 28 Other Operating Sources and (Uses) 0 34,296 (21,333) (21,333) 29 Cash Flow from Operating Activities 6,327 563,786 676,544 811,852 30 974,223 1, 169,067 4,241,800 31 Purchases of property & equip., & other capital expenditures 61,053 61,053 32 Other Investing Activities 2,899 oo o 2,899 33 Cash Flow from Investing Activities (58, 154) " olo olo 34 (58, 154) 35 Increase or (Decrease) in Debt (58,114 36 Increase or (Decrease) in Common Stock (58, 114) 46,327 37 Dividend Payment 46,327 olo o o o oo ooo 38 Other Financing Activities 18,078 Payments would be entered as a negative. 18,078 39 Cash Flow from Financing Activities 6,291 OF 40 6,291 41 Cumulative Translation Adjustment (364) (364) (364) (364) (364) (364 (2, 184 For this course, we will assume zero change over 10 years. 42 NET CASH FLOW (5,900) 563,422 676, 180 811,488 973,859 1,168,703 Free Cash Flow 4,187,753 (14,726) 563,786 676,544 $11,852 74,223 1,169,067 4,180,747 A5 VALLIATION CALCULATION Financial History Capital Structure Valuation Ready & Accessibility: Investigate + 100%Corp Fin - Wk 5 Q Search Sheet Home Insert Draw Page Layout Formulas Data Review View '+ Share ~ Arial A Wrap Text Custom Insert A Delete Paste B I U Merge & Center $ 7 % .00 Conditional Format Cell Sort & Find & Formatting as Table Styles Format Filter Select 09 X V fx A B C D E F G H K L M N O P Q R S This tab is used for the corporate valuation report (Final Project I). Enter data (forecasts based on assumptions you will explain in written report) in yellow cells only. Past performance and trends, text, course resources, research and CURRENCY USD 2021 2022 2023 2024 2025 2026 Total 5 VALUATION CALCULATIONS 46 FREE CASH FLOW "FCF" (from above) (14,726) 563, 786 676,54 811,852 974,223 1,169,067 4,180,747 For the project analysis, we EXCLUDE the funding proceeds & repayment. 49 NET PRESENT VALUE "NPV" OF FUTURE FREE CASH FLOWS 50 NPV @ discount rate of 5.0% $ 3,569,384 For low-risk companies. The value here is what you may be willing to pay to buy the company under these assumptions. 51 v @ discount rate of 10.0% $ 3,072,923 For medium-risk companies. The value here is what you may be willing to pay to buy the company under these assumptions. 52 NPV @ discount rate of 18.0% $ 2,471,290 For high-risk companies. The value here is what you may be willing to pay to buy the company under these assumptions. 53 54 55 If you had bought the whole company at the end of fiscal 2021 for its actual market value of ---> $1,717,216 (From Financial History worksheet, = share price x # of shares) 56 57 Free Cash Flows w/Initial Investment (1,717,216) 563,786 676,544 811,852 974,223 1,169,067 2,478,257 Initial Investment = initial cash outflow, which would be entered as a negative 58 Cumulative (initial cash outflow and future FCF's) (1,717,216) (1,153,430) (476,886) 334,96 1,309, 189 2,478,257 59 Positive cumulative cash flows during the 10-year period? FALSE FALSE TRUE TRUE TRUE Breakeven point happens between the years when the negative cumulative NCF first changes to positive. (It could turn 60 61 Internal Rate of Return (IRR) 33.7% IRR At this discount rate (IRR,) the present value of future cash flows (Cells F56 through 056) equals initial invesment (E56) aka NPV will equal $0. Consider what the result means especially if it's negative. Also consider what forecasting additional years may 62 63 MODIFIED INTERNAL RATE OF RETURN (MIRR) 64 Financing Rate 0.0%
Step by Step Solution
There are 3 Steps involved in it

Get step-by-step solutions from verified subject matter experts