

Question: ** Correct answer is 129, but not sure why. I need help reading the z chart/getting the z value. I don't know which row/column to
** Correct answer is 129, but not sure why. I need help reading the z chart/getting the z value. I don't know which row/column to be looking at.
#4) Suppose you have a pilot sample of size 16 that yields a sample standard deviation of 7.7. What is the sample size needed to estimate a population mean to within a margin of error of (plus or minus) 2 units given that the confidence level is 99%?
a) 129
b) 130
c) 131
d) 132
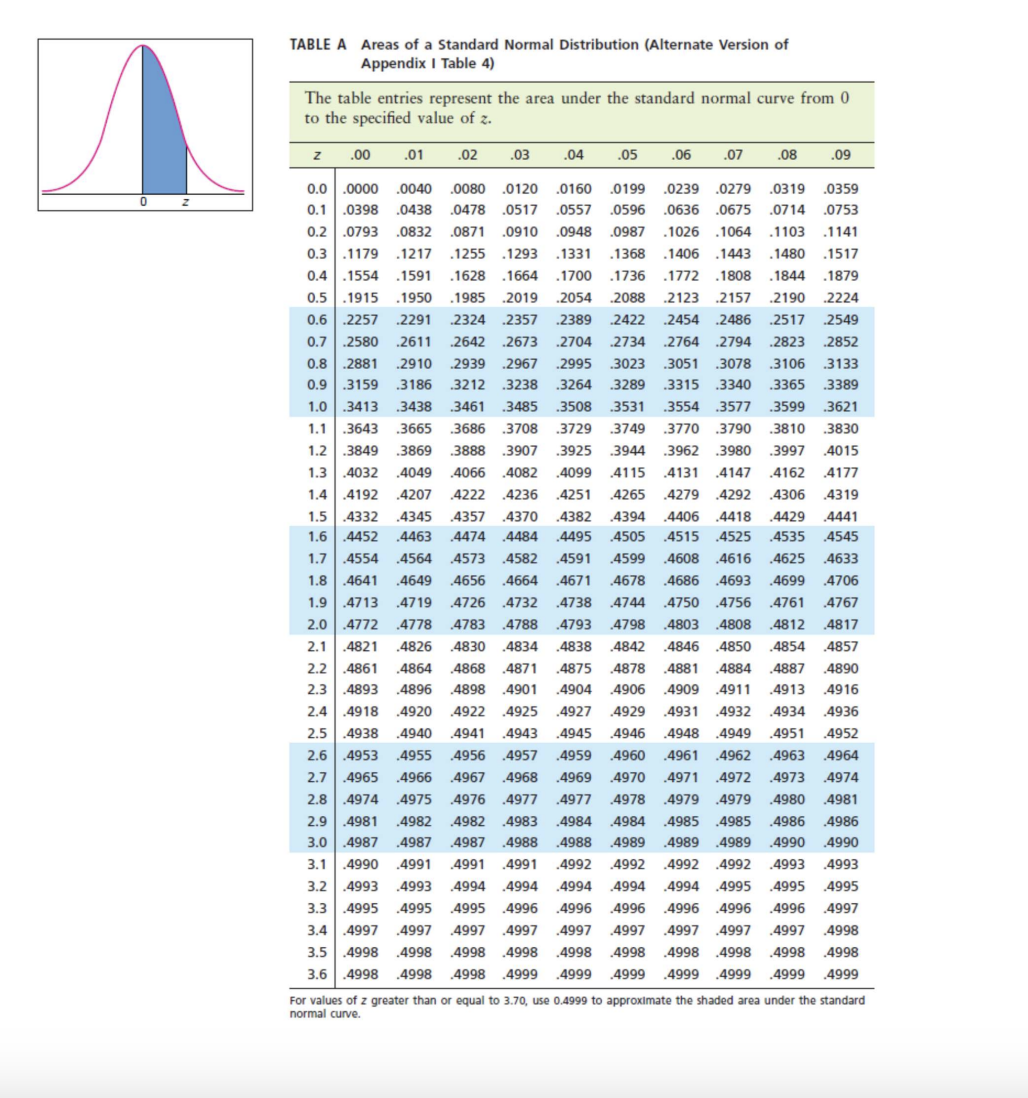
TABLE A Areas of a Standard Normal Distribution (Alternate Version of Appendix I Table 4) The table entries represent the area under the standard normal curve from 0 to the specified value of z. z .00 .01 .02 .03 .04 .05 .06 .07 .08 .09 0 Z 0.0 0000 0040 0.1 .0398 .0438 0.2 .0793 .0832 0.3 1179 .1217 0.4 .1554.1591 .1628 .1664 0.5 1915 .1950 .1985 2019 0.6 .2257 .2291 .2324 .2357 0.7 2580 .2611 .2642 .2673 0.8 .2881 .2910 .2939 .2967 0.9 .3159 .3186 .3212 .3238 1.0 .3413 .3438 .3461 .3485 1.1 .3643 .3665 .3686 .3708 1.2 .3849 .3869 .3888 .3907 1.3 .4032 .4049 .4066 .4082 1.4 .4192 .4207 .4222 .4236 1.5 .4332 .4345 .4357 .4370 1.6 .4452 .4463 .4474 .4484 1.7 .4554 .4564 .4573 .4582 1.8 .4641 .4649 .4656 .4664 1.9 .4713 .4719 .4726 .4732 .0080 0120 .0160 .0199 .0239 .0279 .0319 .0359 .0478 .0517 .0557 .0596 .0636 .0675 .0714 .0753 .0871.0910 .0948 .0987 .1026 .1064 .1103 .1141 .1255.1293 .1331 .1368 .1406 .1443 .1480 .1517 .1700 .1736 .1772 .1808 1844 .1879 2054 .2088 .2123 .2157 .2190 .2224 .2389 .2422 .2454 .2486 .2517 .2549 .2704 .2734 .2764 .2794 .2823 .2852 .2995 .3023 .3051 .3078 .3106 .3133 .3264 .3289 .3315 .3340 .3365 .3389 .3508 .3531 .3554 .3577 .3599 .3621 .3729 .3749 .3770 .3790 .3810 .3830 .3925 .3944 .3962 .3980 .3997 .4015 .4099 .4115 .4131 4147.4162 .4177 .4251 .4265 .4279 .4292 .4306 .4319 .4382 .4394 .4406 .4418 .4429 .4441 .4495 .4505 .4515 .4525 .4535 .4545 .4591 .4599 .4608 .4616 .4625 .4633 .4671 .4678 .4686 .4693 .4699 .4706 .4738 .4744 .4750 .4756 .4761 .4767 .4783 .4788 .4793 2.0 .4772 .4778 .4798 .4803 .4808 .4812 .4817 2.1 .4821 .4826 .4830 .4834 .4838 .4842 .4846 .4850 .4854 .4857 2.2 .4861 .4864 .4868 .4871 .4875 .4878 .4881 .4884 .4887 .4890 2.3 4893 .4896 .4898 .4901 .4904 .4906 4909 .4911 .4913 .4916 2.4 .4918 .4920 .4922 .4925 .4927 .4929 .4931 .4932 .4934 .4936 2.5 .4938 .4940 .4941 .4943 .4945 .4946 4948 .4949 .4951 .4952 2.6 .4953 .4955 .4956 .4957 .4959 .4960 .4961 .4962 .4963 .4964 2.7 .4965 .4966 .4967 .4968 .4969 .4970 .4971 .4972 .4973 .4974 2.8 .4974 .4975 .4976 .4977 .4977 .4978 .4979 .4979 4980 .4981 2.9 .4981 .4982 .4982 .4983 .4984 .4984 .4985 .4985 .4986 .4986 3.0 .4987 .4987 .4987 4988 .4988 .4989 .4989 .4989 .4990 .4990 3.1 .4990 .4991 .4991 .4991 .4992 .4992 .4992 .4992 .4993 .4993 3.2 .4993 .4993 .4994 4994 .4994 .4994 .4994 .4995 .4995 .4995 3.3 .4995 .4995 .4995 .4996 .4996 .4996 .4996 4996 .4996 .4997 3.4 4997 .4997 .4997 4997 .4997 .4997 .4997 .4997 .4997 .4998 3.5 .4998 4998 .4998 .4998 .4998 .4998 .4998 4998 4998 4998 3.6 .4998 4998 4998 4999 .4999 4999 .4999 4999 .4999 .4999 For values of z greater than or equal to 3.70, use 0.4999 to approximate the shaded area under the standard normal curve.
Step by Step Solution
There are 3 Steps involved in it

Get step-by-step solutions from verified subject matter experts