

Question: Corrected absorbance The data in Table 4-8, up to and including 20.0 ug of protein, was used to prepare the linear calibration curve in Figure
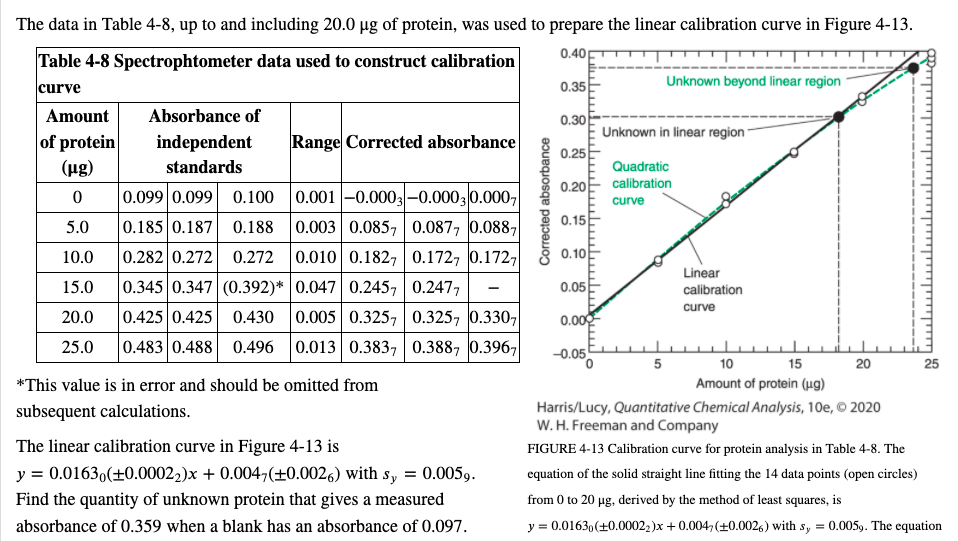
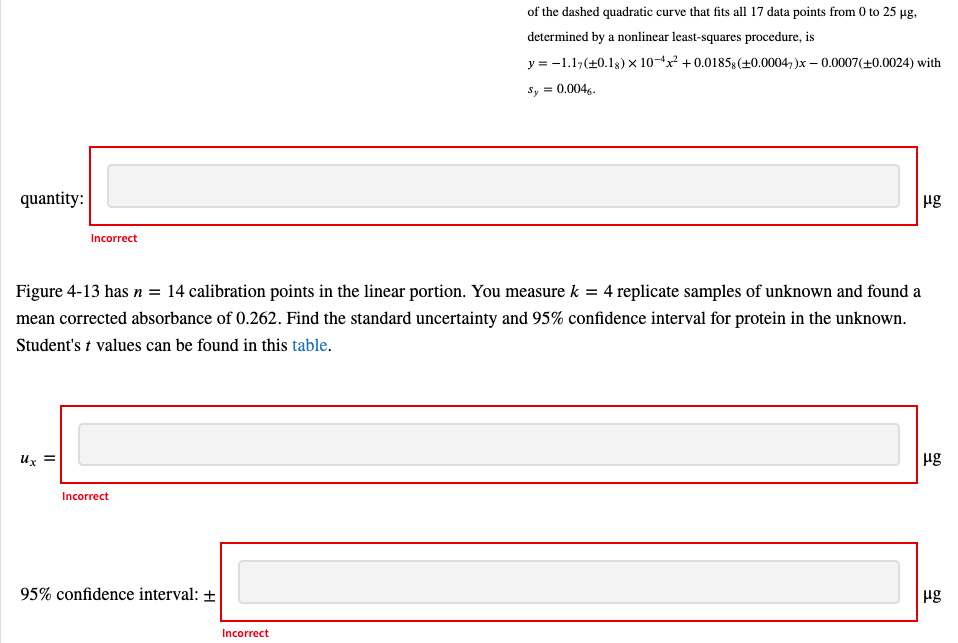
Corrected absorbance The data in Table 4-8, up to and including 20.0 ug of protein, was used to prepare the linear calibration curve in Figure 4-13. Table 4-8 Spectrophtometer data used to construct calibration 0.40 curve 0.35 Unknown beyond linear region Amount Absorbance of 0.30 of protein independent Range Corrected absorbance Unknown in linear region 0.25 (ug) standards Quadratic 0.20 calibration 0 0.099 0.099 0.100 0.001 -0.0003 -0.00030.0007 curve 5.0 0.185 0.187 0.188 0.003 0.085, 0.0877 0.0887 0.15 10.0 0.282 0.272 0.272 0.010 0.1827 0.1727 0.1727 0.10 Linear 15.0 0.345 0.347 (0.392)* 0.047 0.2457 0.2477 0.05 calibration curve 20.0 0.425 0.425 0.430 0.005 0.3257 0.325, 0.3307 0.000 25.0 0.483 0.488 0.496 0.013 0.3837 0.3887 0.3967 -0.05 5 10 15 20 25 *This value is in error and should be omitted from Amount of protein (ug) subsequent calculations. Harris/Lucy, Quantitative Chemical Analysis, 10e, 2020 W. H. Freeman and Company The linear calibration curve in Figure 4-13 is FIGURE 4-13 Calibration curve for protein analysis in Table 4-8. The y = 0.0163,(+0.00022)x + 0.0047 (+0.0026) with sy = 0.005, equation of the solid straight line fitting the 14 data points (open circles) Find the quantity of unknown protein that gives a measured from 0 to 20 hg, derived by the method of least squares, is absorbance of 0.359 when a blank has an absorbance of 0.097. y = 0.01630(+0.00022 )x +0.004;(+0.0026) with sy = 0.0059. The equation of the dashed quadratic curve that fits all 17 data points from 0 to 25 mg, determined by a nonlinear least-squares procedure, is y=-1.17(+0.13) x 10-4x2 +0.01858(+0.0004,)x -0.0007(+0.0024) with Sy = 0.004. quantity: ug Incorrect Figure 4-13 has n = 14 calibration points in the linear portion. You measure k = 4 replicate samples of unknown and found a mean corrected absorbance of 0.262. Find the standard uncertainty and 95% confidence interval for protein in the unknown. Student's t values can be found in this table. = ug Incorrect 95% confidence interval: + ug Incorrect
Step by Step Solution
There are 3 Steps involved in it

Get step-by-step solutions from verified subject matter experts