

Question: **Correlation and Regression Questions** Please answer the three questions in the document and show work. SAT Score 1110 1350 1300 1140 960 1400 1440 1450
**Correlation and Regression Questions** Please answer the three questions in the document and show work.
SAT Score
1110
1350
1300
1140
960
1400
1440
1450
1260
1370
1410
1550
1520
1110
1230
1360
1380
1060
1320
1290
1080
960
1160
1240
1400
1460
1500
1520
1550
1300
1140
1230
1330
1280
1300
1200
1080
1260
GPA
3.1
3.7
3.8
2.8
2.9
3.8
4.1
4.3
3.5
3.8
4.0
4.4
4.3
2.9
3.0
3.6
3.9
3.0
3.6
3.6
3.2
2.7
2.8
3.0
4.2
4.2
4.3
4.3
4.4
3.8
3.2
2.9
3.4
3.6
3.6
3.5
2.7
3.4
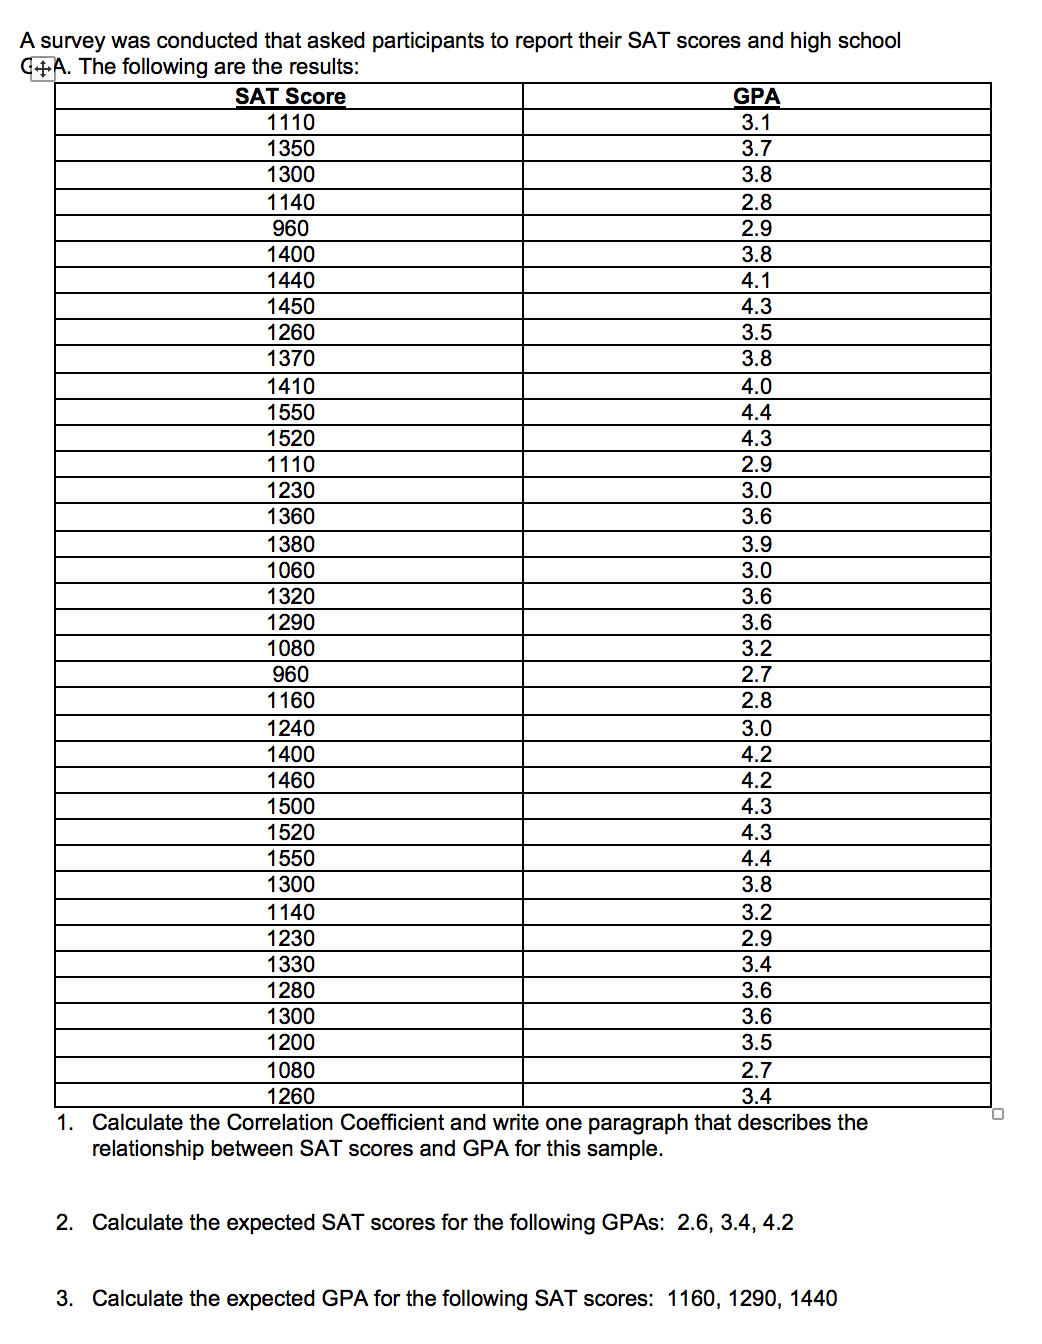
A survey was conducted that asked participants to report their SAT scores and high school C +A. The following are the results: SAT Score 1110 GPA 3.1 1350 1300 3.7 1140 3.8 2.8 960 1400 2.9 1440 3.8 4.1 1450 1260 4.3 1370 3.5 3.8 1410 4.0 1550 1520 4.4 110 4.3 1230 2.9 1360 3.0 3.6 1380 3.9 1060 3.0 1320 1290 3.6 3.6 1080 960 3.2 1160 2.7 1240 2.8 3.0 1400 1460 4.2 1500 4.2 4.3 1520 1550 4.3 1300 4.4 3.8 1 140 1230 3.2 133 2.9 3.4 1280 1300 3.6 1200 3.6 1080 3.5 2.7 1260 1. 3.4 Calculate the Correlation Coefficient and write one paragraph that describes the relationship between SAT scores and GPA for this sample. 2. Calculate the expected SAT scores for the following GPAs: 2.6, 3.4, 4.2 3. Calculate the expected GPA for the following SAT scores: 1160, 1290, 1440
Step by Step Solution
There are 3 Steps involved in it

Get step-by-step solutions from verified subject matter experts