

Question: Correlation coefficient r=___Test statistic = ___P value =___ Use the given data to find the equation of the regression line. Examine the scatterplot and identify
Correlation coefficient r=___Test statistic = ___P value =___
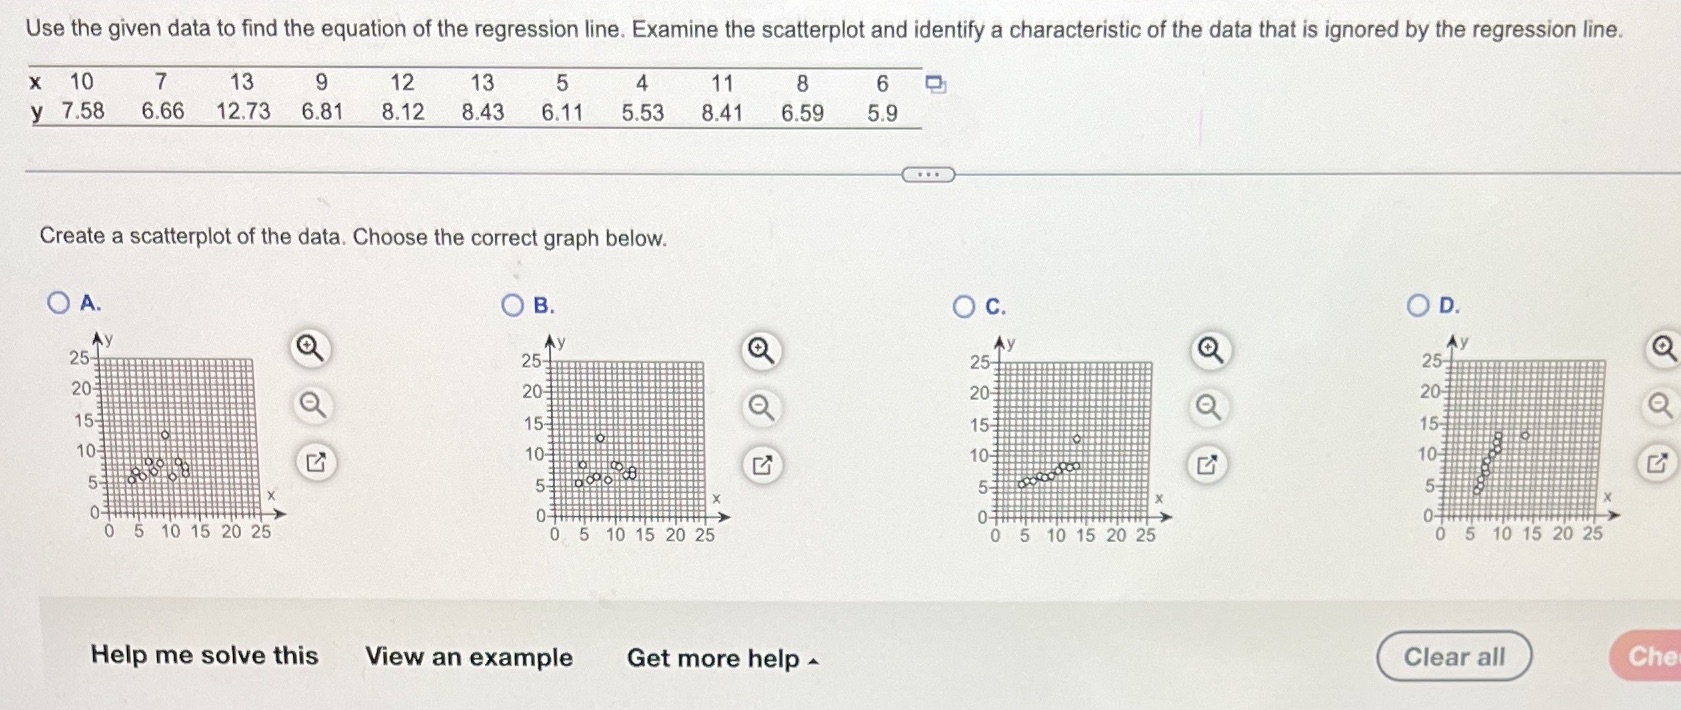
Use the given data to find the equation of the regression line. Examine the scatterplot and identify a characteristic of the data that is ignored by the regression line. x 10 7 13 9 12 13 5 4 11 8 6 y 7.58 6.66 12.73 6.81 8.12 8.43 6.11 5.53 8.41 6.59 5.9 Create a scatterplot of the data. Choose the correct graph below. O A. O B. O C. OD. Ay 25 25 25- 20 20 ## 20 20 15 158 15# 15- 10 10 5 0 5 10 15 20 25 0 5 10 15 20 25 0 5 10 15 20 25 0 5 10 15 20 25 Help me solve this View an example Get more help - Clear all Che
Step by Step Solution
There are 3 Steps involved in it
1 Expert Approved Answer
Step: 1 Unlock

Question Has Been Solved by an Expert!
Get step-by-step solutions from verified subject matter experts
Step: 2 Unlock
Step: 3 Unlock