

Question: Correlation Coefficients Overview Purpose Correlation coefficients describe the statistical relationship between two variables. The purpose of computing a correlation is to understand how two variables
Correlation Coefficients Overview
Purpose
Correlation coefficients describe the statistical relationship between two variables. The purpose of computing a correlation is to understand how two variables are related.For example, there is a positive correlation between income and educationpeople with higher income have more years of education. You can also phrase it that people with more years of education have higher income. Thus, knowing how many years of education a person has allows you to predict their income to some degree.
There are two components:
- The sign: Positive or Negative
- Positive correlationhigh scores on one variable are associated with high scores on other variable
- Negative correlationhigh scores on one variable are associated with low scores on other variable
- The number: Indicates the strength of the relationship
- Ranges from -1.00 to +1.00
- Zero correlation: no relationship between the measures
- Numbers less than 1.00 indicate that there is some relationship, but the relationship is not perfect. As the number approaches 1.0, the strength of the relationship increases, whereas numbers closer to 0 represent a weaker correlation.
Positive correlation
- With a positive correlation, as one variable increases, the value of the second variable also increases. Likewise, as one variable decreases, the value of the other variable also decreases.
- Examples of positive correlations: size of house and income; outside temperature and ice cream consumption
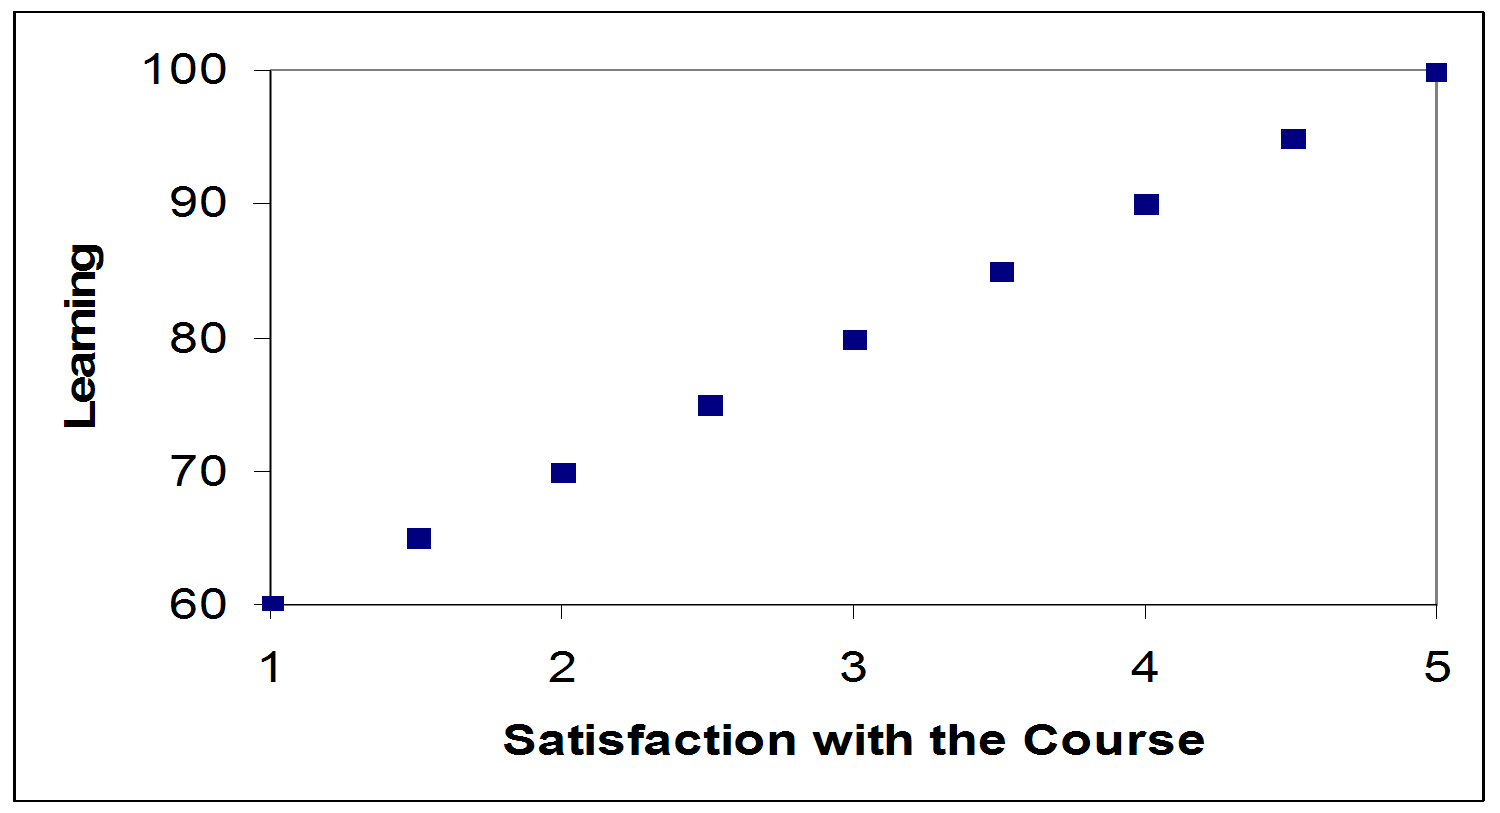
- The graph on the left below represents a correlation of +1.0 between learning and course satisfaction. As satisfaction increases, learning increases.
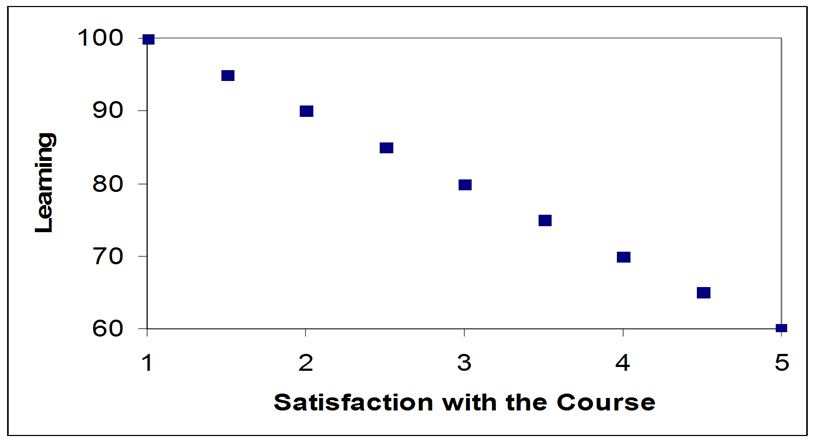
Positive Correlation; r = +1.0 Negative Correlation; r = -1.0


 Negative correlation
- With a negative correlation, as one variable increases, the value of the second variable decreases. Likewise, as one variable decreases, the value of the other variable increases.
- It is an inverse correlation. The word negative is a label that shows the direction of the correlation.
- Examples of negative correlations: distance you live from family and number of times you see them per year; immune system functioning and sickness.
- The graph on the right above represents a correlation of -1.0 between learning and course satisfaction. As satisfaction increases, learning decreases.
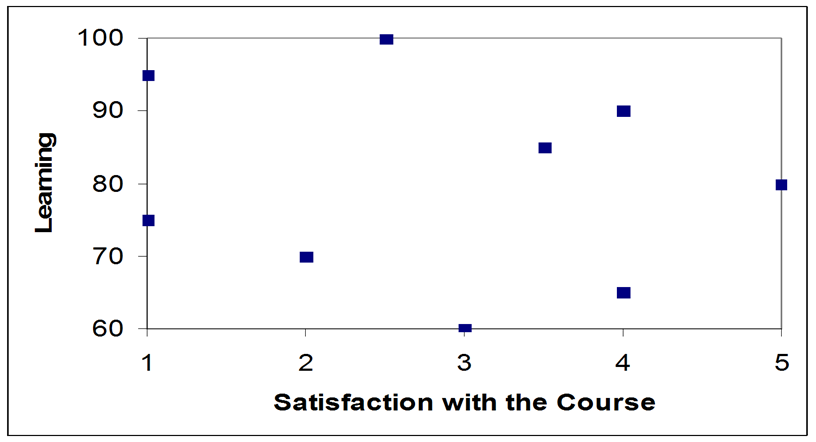
Null correlation (r= 0)
- A null correlation or correlation of zero indicates that two variables are unrelated.
- Values close to zero (e.g., a correlation of .12) represents a weak relationship.
- The example below represents a correlation of 0 between learning and course satisfaction. Thus, knowing how much someone learned in a course provides you with no information on their course satisfaction.
Instructions: Match the variables with the correlation coefficient.
Notable Correlations
_____ 1. Height & weight a. r= .28
_____ 2. Viagra & sexual functioning b. r = .44
_____ 3. Ibuprofen & pain reduction c. r = .38
_____ 4. Weight gain & income men d. r = -.38
_____ 5. Weight gain & income women e. r= .14
Correlations Related to Organizational Behavior
_____ 1. Job satisfaction & productivity a. r = -.51
_____ 2. Intelligence & job performance b. r = .51
_____ 3. Age & job performance c. r = .30
_____ 4. Unemployment rate & absenteeism* d. r= -.01
Satisfaction with the Course Satisfaction with the Course
Step by Step Solution
There are 3 Steps involved in it

Get step-by-step solutions from verified subject matter experts