

Question: Correlation Problem 2 xlsx 10 KB Click to see additional instructions Question 5: Download the attached Excel spreadsheet. This spreadsheet contains data for two variables,
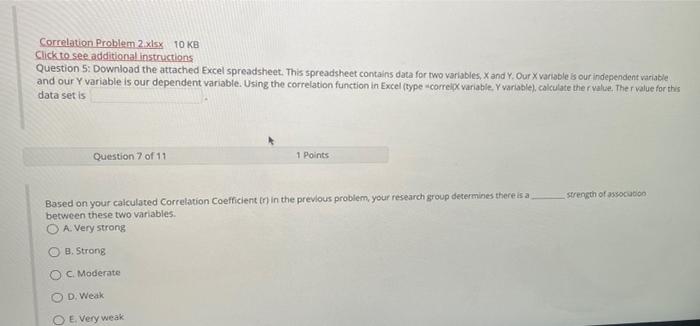
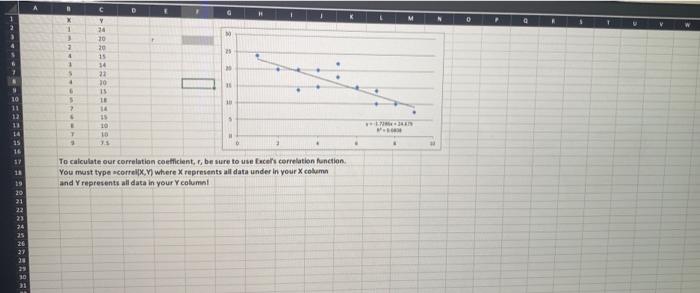
Correlation Problem 2 xlsx 10 KB Click to see additional instructions Question 5: Download the attached Excel spreadsheet. This spreadsheet contains data for two variables, X and Y. Our X variable is our independent variable and our Y variable is our dependent variable. Using the correlation function in Excel (type-correl variable. Y variable), calculate the r value, Ther value for this data set is Question 7 of 11 1 Points strength of association Based on your calculated Correlation coefficient in in the previous problem, your research group determines there is a between these two variables. O A Very strong O B. Strong OC Moderate D. Weak O E Very weak D H1 X 1 2 23 1 C Y 26 20 20 15 14 21 30 15 18 14 11 10 18 10 10 S ? 6 11 14 15 T . 17 11 19 20. 21 To calculate our correlation coefficient, be sure to use Excel's correlation function You must type correl.) where X represents all data under in your column and represents all data in your Y column 23 24 26 27 20 23 Correlation Problem 2 xlsx 10 KB Click to see additional instructions Question 5: Download the attached Excel spreadsheet. This spreadsheet contains data for two variables, X and Y. Our X variable is our independent variable and our Y variable is our dependent variable. Using the correlation function in Excel (type-correl variable. Y variable), calculate the r value, Ther value for this data set is Question 7 of 11 1 Points strength of association Based on your calculated Correlation coefficient in in the previous problem, your research group determines there is a between these two variables. O A Very strong O B. Strong OC Moderate D. Weak O E Very weak D H1 X 1 2 23 1 C Y 26 20 20 15 14 21 30 15 18 14 11 10 18 10 10 S ? 6 11 14 15 T . 17 11 19 20. 21 To calculate our correlation coefficient, be sure to use Excel's correlation function You must type correl.) where X represents all data under in your column and represents all data in your Y column 23 24 26 27 20 23
Step by Step Solution
There are 3 Steps involved in it

Get step-by-step solutions from verified subject matter experts