

Question: CoSO I. Exponential Functions and their Graphs - Assignment Score: 2/34 2/34 answered Question 7 The fox population in a certain region has an annual
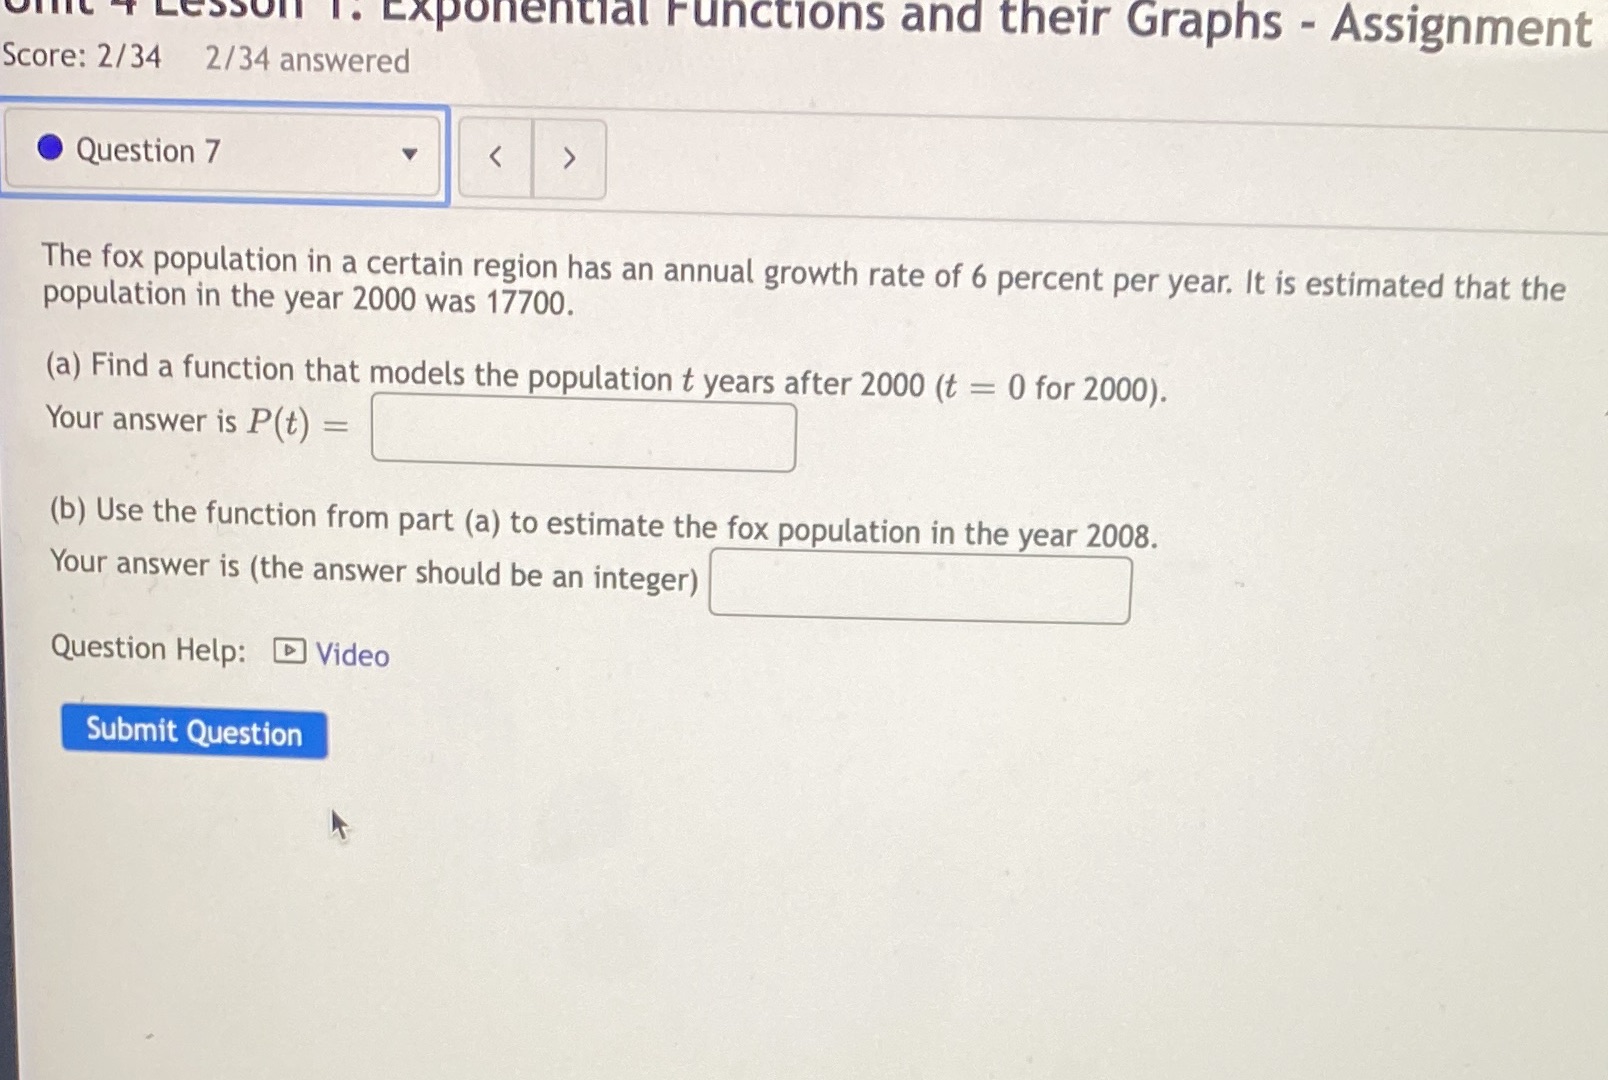
CoSO I. Exponential Functions and their Graphs - Assignment Score: 2/34 2/34 answered Question 7 The fox population in a certain region has an annual growth rate of 6 percent per year. It is estimated that the population in the year 2000 was 17700. (a) Find a function that models the population t years after 2000 (t = 0 for 2000). Your answer is P(t) = (b) Use the function from part (a) to estimate the fox population in the year 2008. Your answer is (the answer should be an integer) Question Help: Video Submit
Step by Step Solution
There are 3 Steps involved in it
1 Expert Approved Answer
Step: 1 Unlock

Question Has Been Solved by an Expert!
Get step-by-step solutions from verified subject matter experts
Step: 2 Unlock
Step: 3 Unlock