

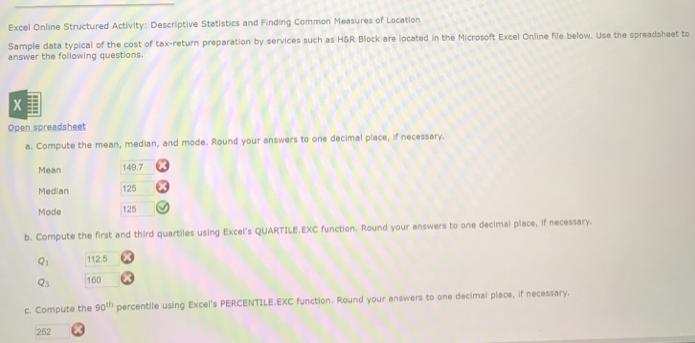
Excel Online Structured Activity: Descriptive Statistics and Finding Common Measures of Location Sample data typical of...
Fantastic news! We've Found the answer you've been seeking!
Question:

Expert Answer:

Related Book For 
Statistics For Business And Economics
ISBN: 9780538481649
11th Edition
Authors: David R. Anderson, Dennis J. Sweeney, Thomas A. Williams
Posted Date:
