

Question: Cost Behavior Analysis using Regression Data should be analyzed in Excel. Everything should be appropriately labeled. 1. Simple Regression: Examine the relationship between the number
Cost Behavior Analysis using Regression Data should be analyzed in Excel. Everything should be appropriately labeled. 1. Simple Regression: Examine the relationship between the number of units produced and the total manufacturing overhead by performing Regression Analysis and generating a Line-fit plot. Consider the following in your analysis: a. What is the coefficient of correlation and what does it say about the relationship? b. What is the coefficient of determination and what does it say about the relationship? c. What is the equation of this line? ( y = mx + b), where Total Cost = (Variable Cost Per Unit * Units) + Total Fixed Cost. 2. Multiple Regression: Examine the relationship between the number of units produced and the number of production batches and their effect on total manufacturing overhead. Consider the following in your report: a. What is the coefficient of determination? How did multiple (versus single) regression help/hurt the r-squared? b. What is the estimated Variable Manufacturing Overhead Per Unit? c. What is the estimated Total Fixed Manufacturing Overhead? 3. Break-Even Analysis: Calculate the following: a. What is the average per Unit Direct Materials Cost? b. What is the average per Unit Direct Labor Cost? c. Assume variable General and Administrative expenses are $12 per unit. What is the total variable cost per unit? d. Assume total fixed General and Administrative expenses are $2,000 per month. What is the total fixed cost per month? e. Assume sales price per unit is $400. What is the Contribution Margin Per Unit? f. What is the Break Even Point in Units?
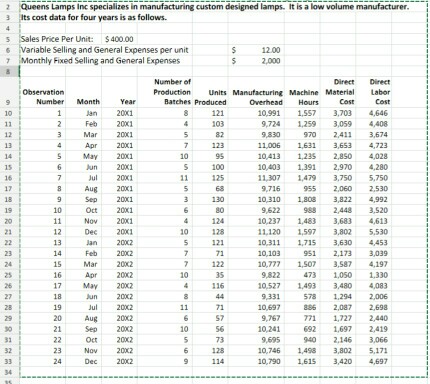
2 Queens Lampsinc specializes in manufacturing custom designed lamps. It isalow volume manufacturer. 3 Its cost data for four years is as follows. les Price Per Unit: $400.00 ariable Selling and General Expenses per unit Monthly "ed and Genera Expenss Number of Observation Production units Manufacturi ng Machine Material Labor Number Year Batches Produced Jan 20x1. 3,703 11 20001 103 9,724 1.259 3,059 4,408 20001 2,411 3,674 Apr 20x1 3,6S3 4,723 20X1 2850 4,028 un 20X1 10403 2,970 4,280 20X1 11 125 11.307 1,479 3,750 5,750 Aug 20001 9,716 2.060 2,530 200x1 3,822 4,992 10 Oct 20X1 11 20X1 3,633 4,613 12 20X1 128 11.120 1,597 3,802 5,530 20002 121 10,311 1,715 3,630 4,453 20002 951 2,173 Mar 20X2 10,777 3,S87 4,197 16 20X2 473 1.050 1,330 20002 116 10,527 3,480 578 18 20002 9,331 19 200C2 11 10,697 2.087 2,698 20 Aug 20X2 9,767 771 1,727 2,640 20X2 10,241 1,697 2419 31 20002 9,695 2,146 23 20002 10,746 3802 5,171 20002 3,420 4,697 2 Queens Lampsinc specializes in manufacturing custom designed lamps. It isalow volume manufacturer. 3 Its cost data for four years is as follows. les Price Per Unit: $400.00 ariable Selling and General Expenses per unit Monthly "ed and Genera Expenss Number of Observation Production units Manufacturi ng Machine Material Labor Number Year Batches Produced Jan 20x1. 3,703 11 20001 103 9,724 1.259 3,059 4,408 20001 2,411 3,674 Apr 20x1 3,6S3 4,723 20X1 2850 4,028 un 20X1 10403 2,970 4,280 20X1 11 125 11.307 1,479 3,750 5,750 Aug 20001 9,716 2.060 2,530 200x1 3,822 4,992 10 Oct 20X1 11 20X1 3,633 4,613 12 20X1 128 11.120 1,597 3,802 5,530 20002 121 10,311 1,715 3,630 4,453 20002 951 2,173 Mar 20X2 10,777 3,S87 4,197 16 20X2 473 1.050 1,330 20002 116 10,527 3,480 578 18 20002 9,331 19 200C2 11 10,697 2.087 2,698 20 Aug 20X2 9,767 771 1,727 2,640 20X2 10,241 1,697 2419 31 20002 9,695 2,146 23 20002 10,746 3802 5,171 20002 3,420 4,697
Step by Step Solution
There are 3 Steps involved in it

Get step-by-step solutions from verified subject matter experts