

Question: Cost per unit 6 FIGURE 8-2 Average versus Marginal Cost This figure illustrates the average and marginal costs corresponding to the total cost function C
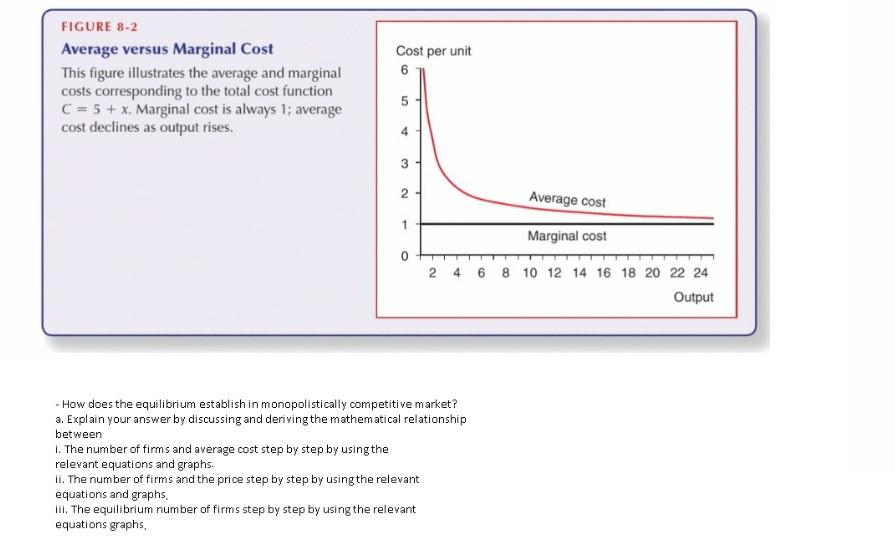
Cost per unit 6 FIGURE 8-2 Average versus Marginal Cost This figure illustrates the average and marginal costs corresponding to the total cost function C = 5 + x. Marginal cost is always 1; average cost declines as output rises. 5 4 3 2 - Average cost 1 Marginal cost 0 2 4 6 8 10 12 14 16 18 20 22 24 Output - How does the equilibrium establish in monopolistically competitive market? a. Explain your answer by discussing and deriving the mathematical relationship between 1. The number of firms and average cost step by step by using the relevant equations and graphs. II. The number of firms and the price step by step by using the relevant equations and graphs III. The equilibrium number of firms step by step by using the relevant equations graphs Cost per unit 6 FIGURE 8-2 Average versus Marginal Cost This figure illustrates the average and marginal costs corresponding to the total cost function C = 5 + x. Marginal cost is always 1; average cost declines as output rises. 5 4 3 2 - Average cost 1 Marginal cost 0 2 4 6 8 10 12 14 16 18 20 22 24 Output - How does the equilibrium establish in monopolistically competitive market? a. Explain your answer by discussing and deriving the mathematical relationship between 1. The number of firms and average cost step by step by using the relevant equations and graphs. II. The number of firms and the price step by step by using the relevant equations and graphs III. The equilibrium number of firms step by step by using the relevant equations graphs
Step by Step Solution
There are 3 Steps involved in it

Get step-by-step solutions from verified subject matter experts