

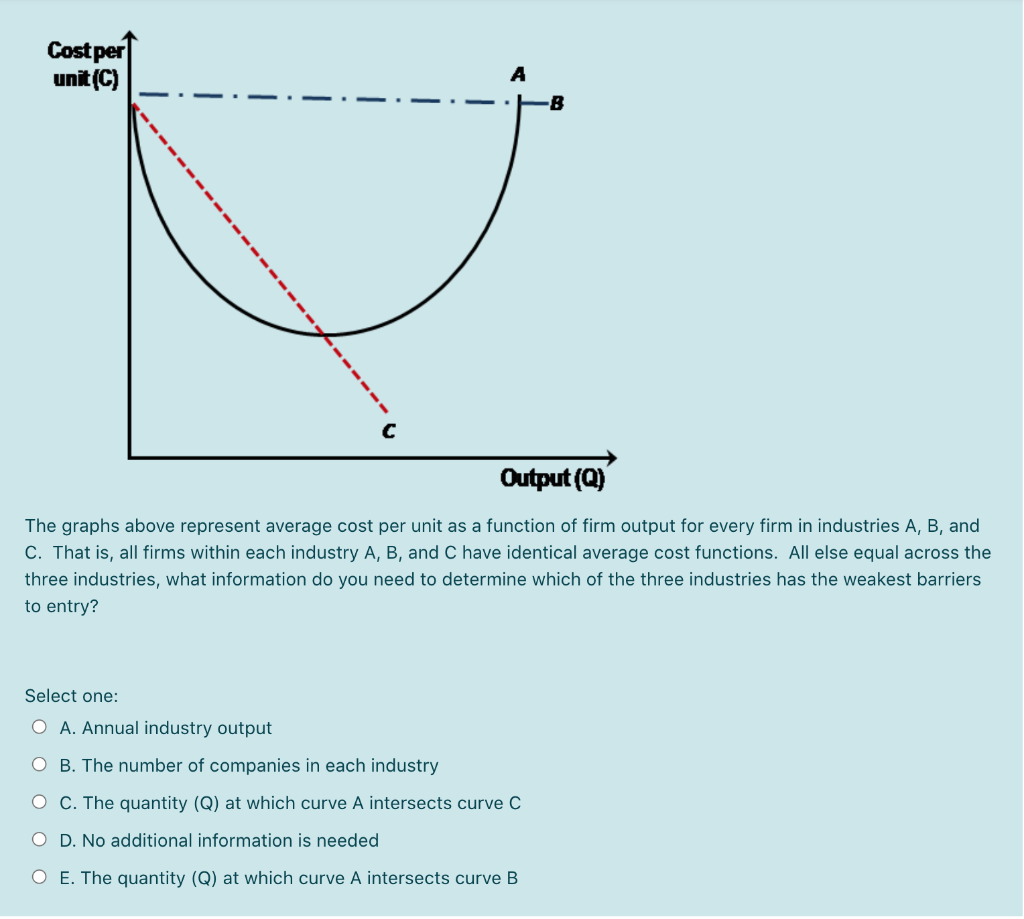
Question: Cost per unit (C) B Output(Q) The graphs above represent average cost per unit as a function of firm output for every firm in industries
Step by Step Solution
There are 3 Steps involved in it
1 Expert Approved Answer
Step: 1 Unlock

Question Has Been Solved by an Expert!
Get step-by-step solutions from verified subject matter experts
Step: 2 Unlock
Step: 3 Unlock