

Question: COSTS Notes: 1. Every Excel outputs should be properly edited. 2. Every Excel output should be shown on your homework answer sheet (Copy your Excel
COSTS
Notes:
1. Every Excel outputs should be properly edited.
2. Every Excel output should be shown on your homework answer sheet (Copy your
Excel outputs from Excel spread sheet, and then paste these outputs on your Word homework answer sheet, here. Do not print Excel outputs. Do not attach them to your homework).
Situation 0
You are the director in North Bend Day Care Center, which is a not-for-profit organization. The Center provides the most affordable day care service to children in North Bend.
Situation 1
North Bend Day Care Center charges each child who the program $300 per month. The cost of supplies and snacks that the Center purchases for each child is $100. The Center pays a rent, $1,000, per month.
(1) Calculate a contribution margin (CM). Show how you calculated a CM.
(2) How many children have to come to the Center each month for it to break even? Show how you calculated the number of children.
Situation 2
You got a notice from the building owner. The notice says that the Center should pay an increased rent, $1,200, from next year.
(3) How many children have to come to the Center each month for it to break even next year?
Show how you calculated a number of children.
(4) However, you expect that the number of children who come to the Center will not be changed
next year. Therefore, how much should the Center charge each child for it to break even next
year given increased rent? Show how you calculated a day care fee.
Situation 3
To understand cost and revenue structure of the Center this year, you want to visualize cost and revenue data of the Center.
(5) Develop cost and revenue data set by filling out the Excel work sheet. Show the data set. Does
the data set completed confirm your answer for (2)?
(6) As we did it in class, create a single Line Chart using the data set you have created (The
single Line Chart should show five lines, such as fixed cost, variable cost, total cost, average
cost, and total revenue lines, at the same time [See Appendix]). Show the Chart. Does the
Chart also confirm your answer for (2)?
[Appendix]
Excel: Creating Line Chart
1. Highlight data on Fixed Cost through Total Revenue including each label (e.g. Fixed Cost, Variable Cost, etc.)
2. In menu bar on the top, Click INSERT in Chart section, Choose Insert Line Chart in 2-D Line section, Choose Line with Markers
3. Edit your chart properly. Especially, you must edit horizontal axis (so called x-axis)
For editing the horizontal axis,
- First, right click anywhere of the chart
- Second, click Select Data
- Third, click Edit in Horizontal (Category) Axis Labels
- Fourth, highlight values of quantity, excluding the label of quantity. In our case, highlight 1 through 10
- Finally, click OK click OK
Initially, the first value of horizontal axis values was 1. But, after editing the axis, the first value should be 0.
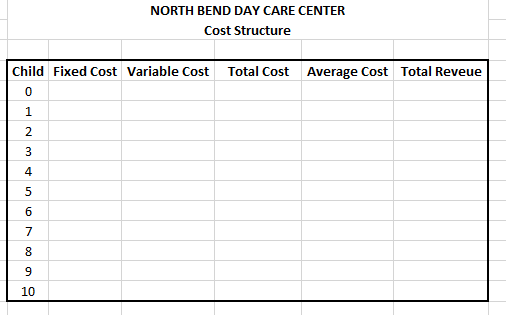
NORTH BEND DAY CARE CENTER Cost Structure Child Fixed Cost Variable Cost Total CostAverage Cost Total Reveue C) 2 4 7 10
Step by Step Solution
There are 3 Steps involved in it

Get step-by-step solutions from verified subject matter experts