

Question: could i get help with: current ratio quick ratio debt ratio debt equity ratio Powered by Clear Tesla Inc (NMS: TSLA) Exchange rate used is

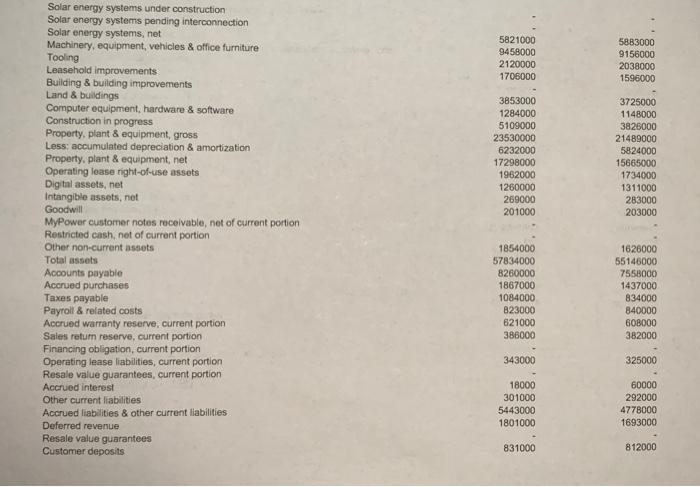
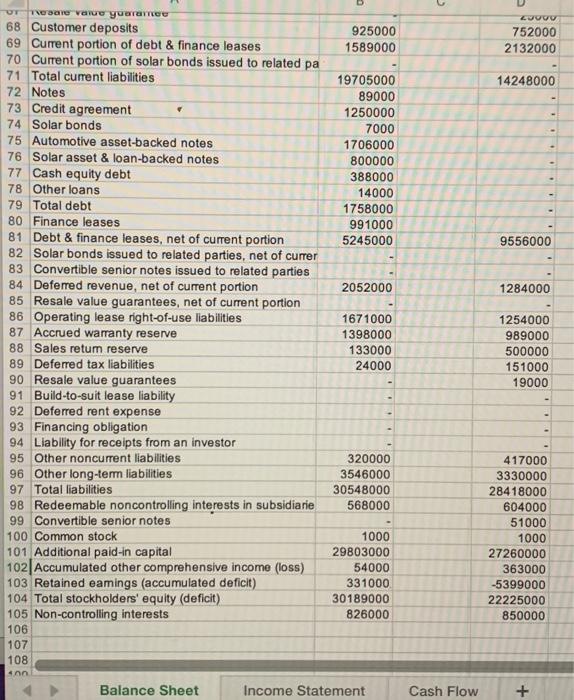
Powered by Clear Tesla Inc (NMS: TSLA) Exchange rate used is that of the Year End reported date As Reported Quarterly Balance Sheet Report Date 09/30/2021 3rd Quarter USD Unaudited Yes Thousands 16065000 30000 06/30/2021 2nd Quarter USD Unaudited Yes Thousands 16229000 Currency Audit Status Consolidated Scale Cash & cash equivalents Short-term marketable securities Restricted cash Accounts receivable, net Raw materials Work in process Finished goods Service parts Inventory Prepaid expenses & other current assets Total current assets Operating lease vehicles, net Solar energy systems in service Initiat direct costs related to customer solar energy system lease acquisition costs Solar energy systems, gross Less: accumulated depreciation & amortization Solar energy systems in service after depreciation & amortization 1962000 2355000 1061000 1252000 531000 5199000 1746000 25002000 4167000 2129000 2067000 858000 1318000 490000 4733000 1602000 24693000 3748000 5821000 9458000 2120000 1706000 5883000 9156000 2038000 1596000 3853000 1284000 5109000 23530000 6232000 17298000 1962000 1260000 269000 201000 3725000 1148000 3826000 21489000 5824000 15665000 1734000 1311000 283000 203000 Solar energy systems under construction Solar energy systems pending interconnection Solar energy systems, net Machinery, equipment, vehicles & office furniture Tooling Leasehold improvements Building & building improvements Land & buildings Computer equipment, hardware & software Construction in progress Property, plant & equipment, gross Less: accumulated depreciation & amortization Property, plant & equipment, net Operating lease right-of-use assets Digital assets, net Intangible assets, net Goodwill MyPower customer notes receivable, net of current portion Restricted cash, not of current portion Other non-current assets Total assets Accounts payable Accrued purchases Taxes payable Payroll & related costs Accrued warranty reserve, current portion Sales return reserve, current portion Financing obligation, current portion Operating lease liabilities, current portion Resale value guarantees, current portion Accrued interest Other current liabilities Accrued liabilities & other current liabilities Deferred revenue Resale value guarantees Customer deposits 1854000 57834000 8260000 1867000 1084000 B23000 621000 386000 1626000 55146000 7558000 1437000 834000 840000 60B000 382000 343000 325000 18000 301000 5443000 1801000 60000 292000 4778000 1693000 831000 812000 > UT 925000 1589000 2000 752000 2132000 14248000 19705000 89000 1250000 7000 1706000 800000 388000 14000 1758000 991000 5245000 9556000 2052000 1284000 Tore value yuarare 68 Customer deposits 69 Current portion of debt & finance leases 70 Current portion of solar bonds issued to related pa 71 Total current liabilities 72 Notes 73 Credit agreement 74 Solar bonds 75 Automotive asset-backed notes 76 Solar asset & loan-backed notes 77 Cash equity debt 78 Other loans 79 Total debt 80 Finance leases 81 Debt & finance leases, net of current portion 82 Solar bonds issued to related parties, net of currer 83 Convertible senior notes issued to related parties 84 Deferred revenue, net of current portion 85 Resale value guarantees, net of current portion 86 Operating lease right-of-use liabilities 87 Accrued warranty reserve 88 Sales retum reserve 89 Deferred tax liabilities 90 Resale value guarantees 91 Build-to-suit lease liability 92 Deferred rent expense 93 Financing obligation 94 Liability for receipts from an investor 95 Other noncurrent liabilities 96 Other long-term liabilities 97 Total liabilities 98 Redeemable noncontrolling interests in subsidiarie 99 Convertible senior notes 100 Common stock 101 Additional paid-in capital 102 Accumulated other comprehensive income (loss) 103 Retained eamings (accumulated deficit) 104 Total stockholders' equity (deficit) 105 Non-controlling interests 106 107 108 1671000 1398000 133000 24000 1254000 989000 500000 151000 19000 320000 3546000 30548000 568000 1000 29803000 54000 331000 30189000 826000 417000 3330000 28418000 604000 51000 1000 27260000 363000 -5399000 22225000 850000 son Balance Sheet Income Statement Cash Flow +
Step by Step Solution
There are 3 Steps involved in it

Get step-by-step solutions from verified subject matter experts