

Question: Could I get some step by step help? ASK YOUR TEACHER A process sampled 20 times with a sample of size B resulted in -
Could I get some step by step help?
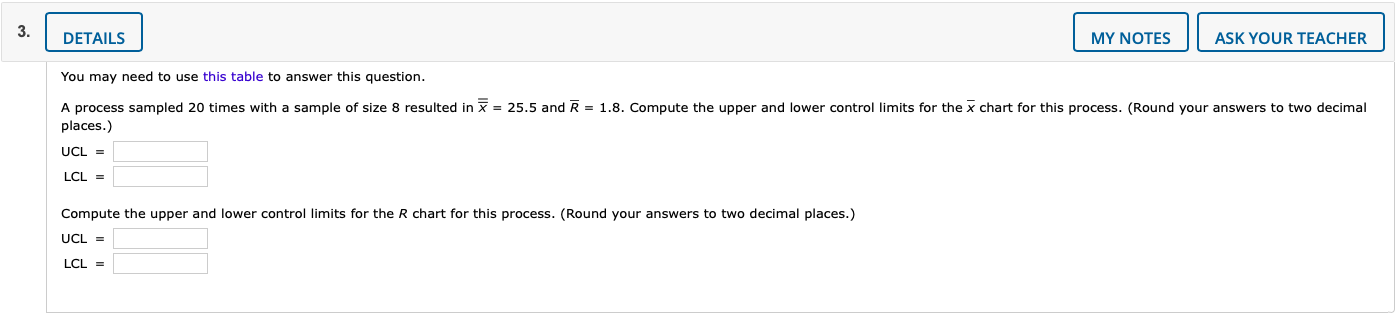
ASK YOUR TEACHER A process sampled 20 times with a sample of size B resulted in - 25.5 and - 1.5. Compute the upper and lower control limits for the E chart for this process. (Round your answers to two decimal places.) You may need to use this table to answer this question. UCL - LCL - Compute the upper and lower control limits for the R chart for this process. (Round your answers to two decimal places.) UCL - LCL
Step by Step Solution
There are 3 Steps involved in it
1 Expert Approved Answer
Step: 1 Unlock

Question Has Been Solved by an Expert!
Get step-by-step solutions from verified subject matter experts
Step: 2 Unlock
Step: 3 Unlock