

Question: Could I please get help with these questions, I have attached the statistic table below and the questions are attached below also. The dataset used
Could I please get help with these questions, I have attached the statistic table below and the questions are attached below also.
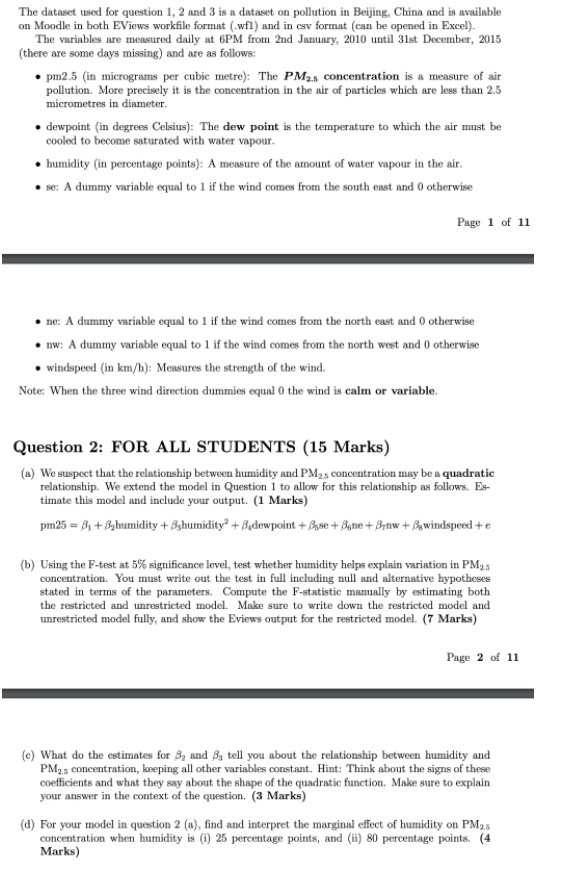
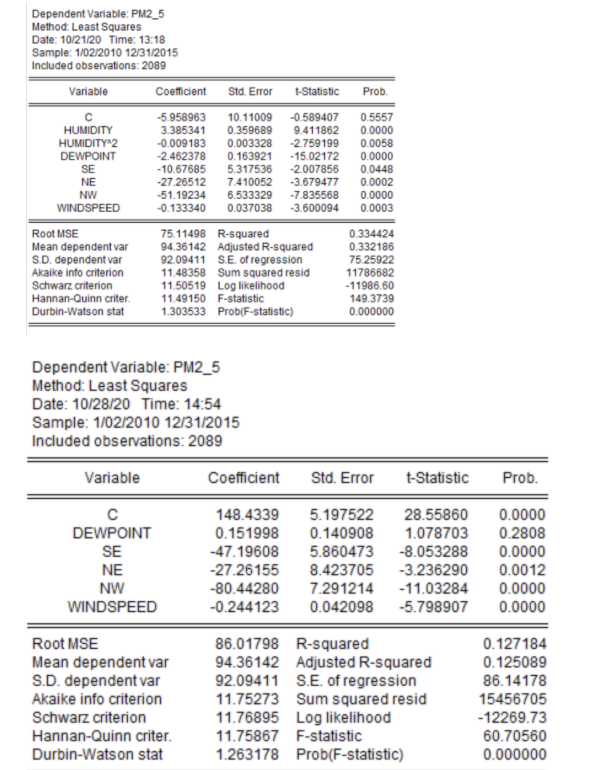
The dataset used for question 1, 2 and 3 is a dataset on pollution in Beijing, China and is available on Moodle in both EViews workfile format (.wfl) and in cav format (can be opened in Excel). The variables are measured daily at 6PM from 2nd January, 2010 until 31st December, 2015 (there are some days missing) and are as follows: . pm2 5 (in micrograms per cubic metre): The PMas concentration is a measure of air pollution. More precisely it is the concentration in the air of particles which are less than 2.5 micrometres in diameter. . dewpoint (in degrees Celsius): The dew point is the temperature to which the air must be cooled to become saturated with water vapour. . humidity (in percentage points): A measure of the amount of water vapour in the air. . se: A dummy variable equal to 1 if the wind comes from the south east and 0 otherwise Page 1 of 11 . ne: A dummy variable equal to 1 if the wind comes from the north east and 0 otherwise . nw: A dummy variable equal to 1 if the wind comes from the north west and 0 otherwise . windspeed (in km/h): Measures the strength of the wind. Note: When the three wind direction dummies equal 0 the wind is calm or variable. Question 2: FOR ALL STUDENTS (15 Marks) (a) We suspect that the relationship between humidity and PMzs concentration may be a quadratic relationship. We extend the model in Question 1 to allow for this relationship as follows. Es- timate this model and include your output. (1 Marks) pm25 = 81 + S,humidity + Sshumidity? + S,dewpoint + Asse + Sone + Brow + &windspeed +e (b) Using the F-test at 5% significance level, test whether humidity helps explain variation in PMgs concentration. You must write out the test in full including null and alternative hypotheses stated in terms of the parameters. Compute the F-statistic manually by estimating both the restricted and unrestricted model. Make sure to write down the restricted model and unrestricted model fully, and show the Eviews output for the restricted model. (7 Marks) Page 2 of 11 (c) What do the estimates for 8, and A, tell you about the relationship between humidity and PMas concentration, keeping all other variables constant. Hint: Think about the signs of these coefficients and what they say about the shape of the quadratic function. Make sure to explain your answer in the context of the question. (3 Marks) (d) For your model in question 2 (a), find and interpret the marginal effect of humidity on PMas concentration when humidity is (i) 25 percentage points, and (ii) 80 percentage points. (4 Marks)Dependent Variable: PM2_5 Method: Least Squares Date: 10/21/20 Time: 13:18 Sample: 1/02/2010 12/31/2015 Included observations: 2089 Variable Coefficient Std. Error 1-Statistic Prob C 5.958963 10.11009 -0.589407 0.5557 HUMIDITY 3.385341 0.359689 9.411862 0.0000 HUMIDITY 2 0.009183 0.003328 -2.759199 0.0058 DEWPOINT -2.462378 0.163921 -15.02172 0.0000 SE -10.67685 5.317536 -2.007856 0.0448 NE -27.26512 7.410052 -3.679477 0.0002 NW 51.19234 6.533329 -7.835568 0.0000 WINDSPEED -0.133340 0.037038 -3.600094 0.0003 Root MSE 75.11498 R-squared 0.334424 Mean dependent var 94.36142 Adjusted R-squared 0.332186 S.D. dependent var 92.09411 S.E. of regression 75.25922 Akaike info criterion 11.48358 Sum squared resid 11786682 Schwarz criterion 11.50519 Log likelihood -11986.60 Hannan-Quinn criter. 11.49150 F-statistic 149.3739 Durbin-Watson stat 1.303533 Prob(F-statistic) 0.000000 Dependent Variable: PM2_5 Method: Least Squares Date: 10/28/20 Time: 14:54 Sample: 1/02/2010 12/31/2015 Included observations: 2089 Variable Coefficient Std. Error t-Statistic Prob C 148.4339 5.197522 28.55860 0.0000 DEWPOINT 0.151998 0.140908 1.078703 0.2808 SE -47.19608 5.860473 -8.053288 0.0000 NE -27.26155 8.423705 -3.236290 0.0012 NW -80.44280 7.291214 -11.03284 0.0000 WINDSPEED -0.244123 0.042098 -5.798907 0.0000 Root MSE 86.01798 R-squared 0.127184 Mean dependent var 94.36142 Adjusted R-squared 0.125089 S.D. dependent var 92.09411 S.E. of regression 86.14178 Akaike info criterion 11.75273 Sum squared resid 15456705 Schwarz criterion 11.76895 Log likelihood -12269.73 Hannan-Quinn criter. 11.75867 F-statistic 60.70560 Durbin-Watson stat 1.263178 Prob(F-statistic) 0.000000
Step by Step Solution
There are 3 Steps involved in it

Get step-by-step solutions from verified subject matter experts