

Question: Could i please get some help with this, it would mean a lot, thank you. Diffraction and Interference X Tools Displays x W Hardware Light
Could i please get some help with this, it would mean a lot, thank you.
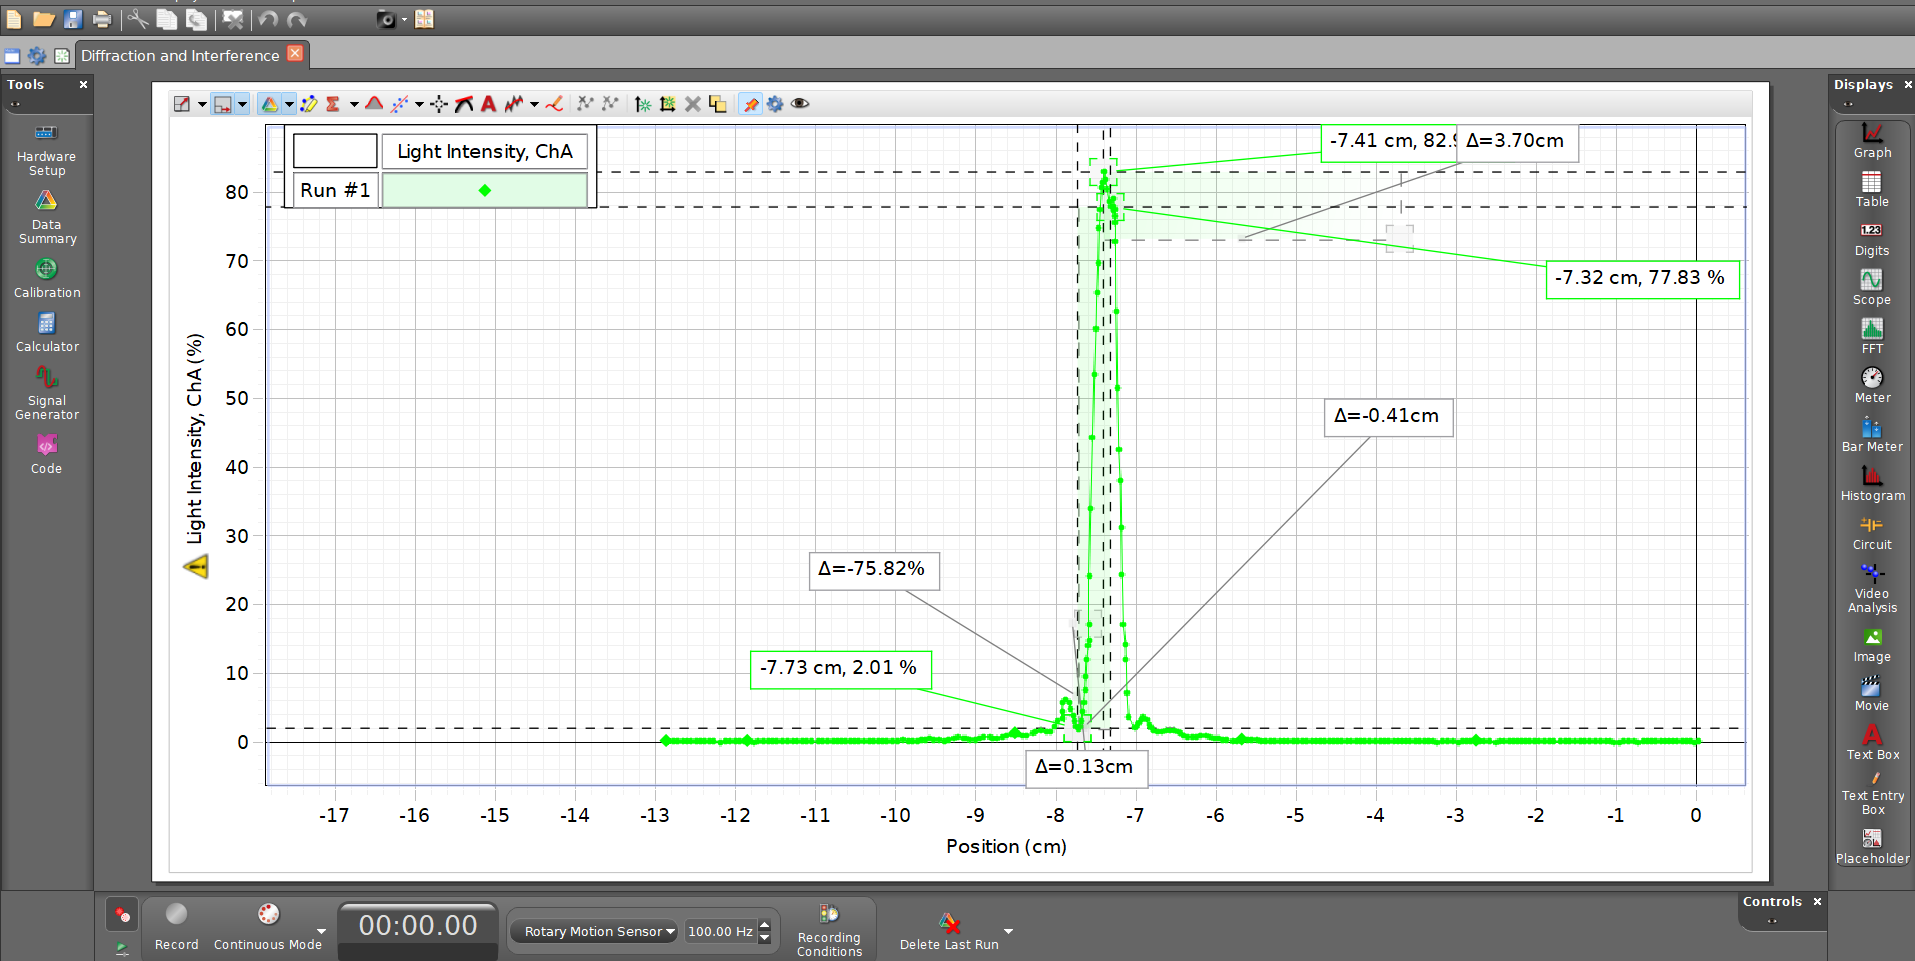
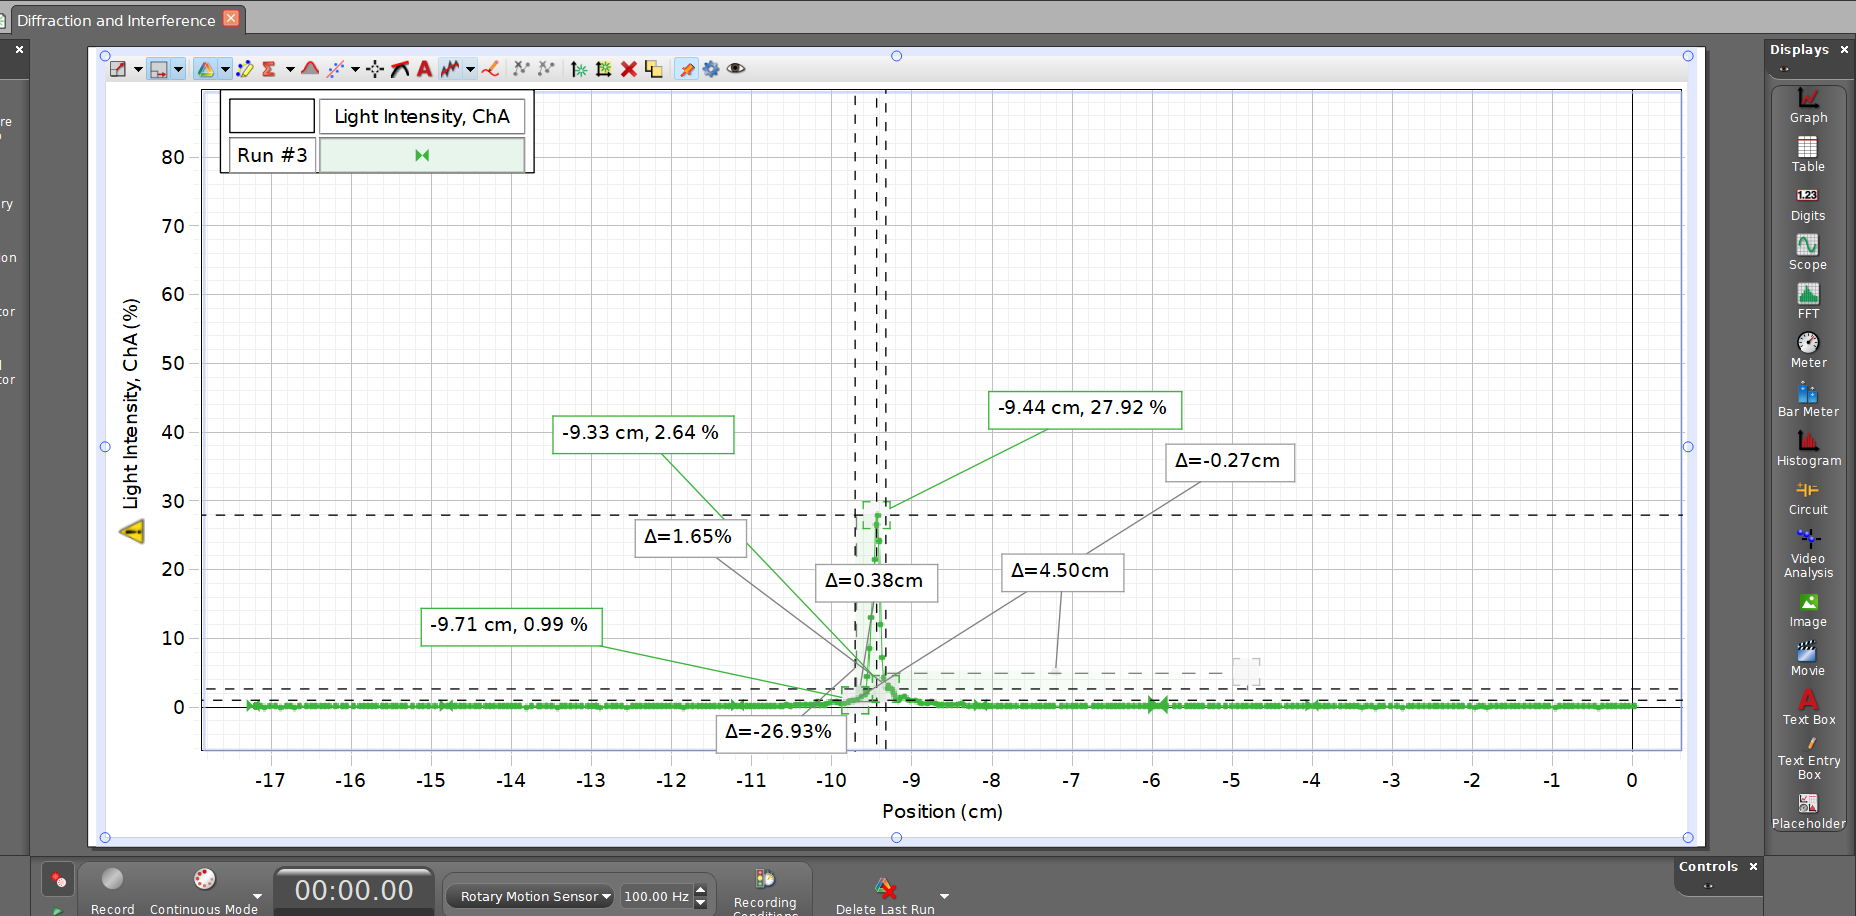
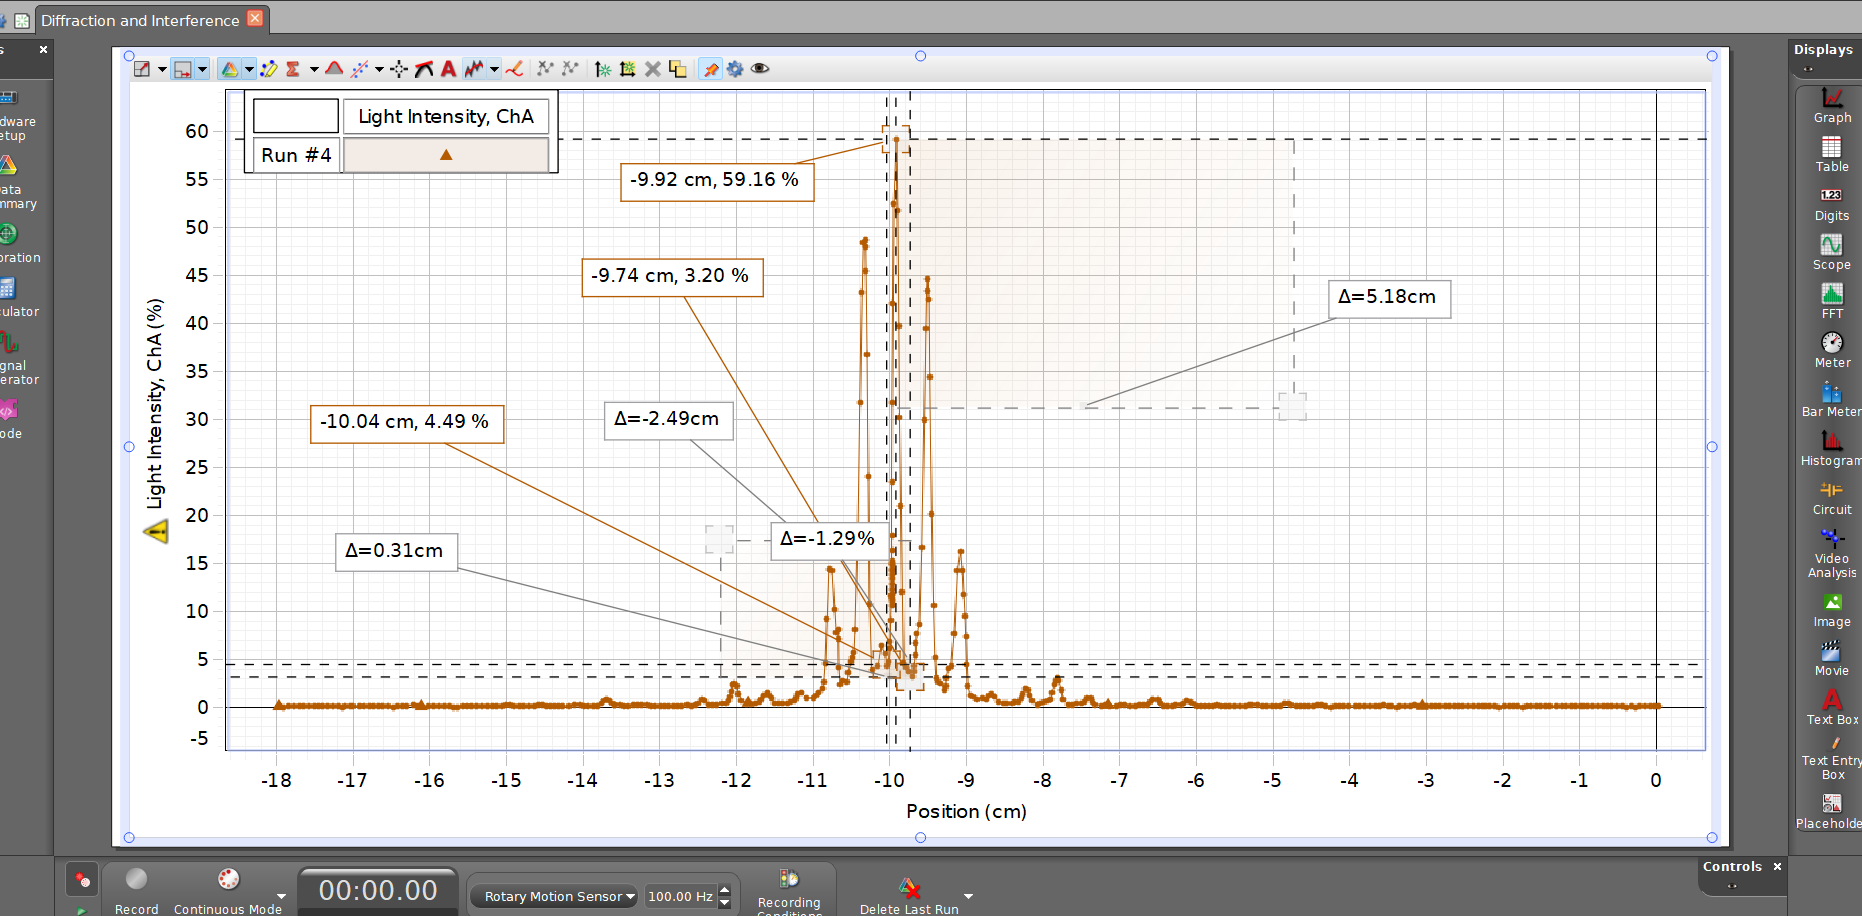
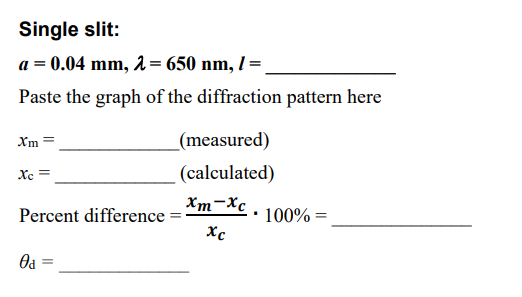
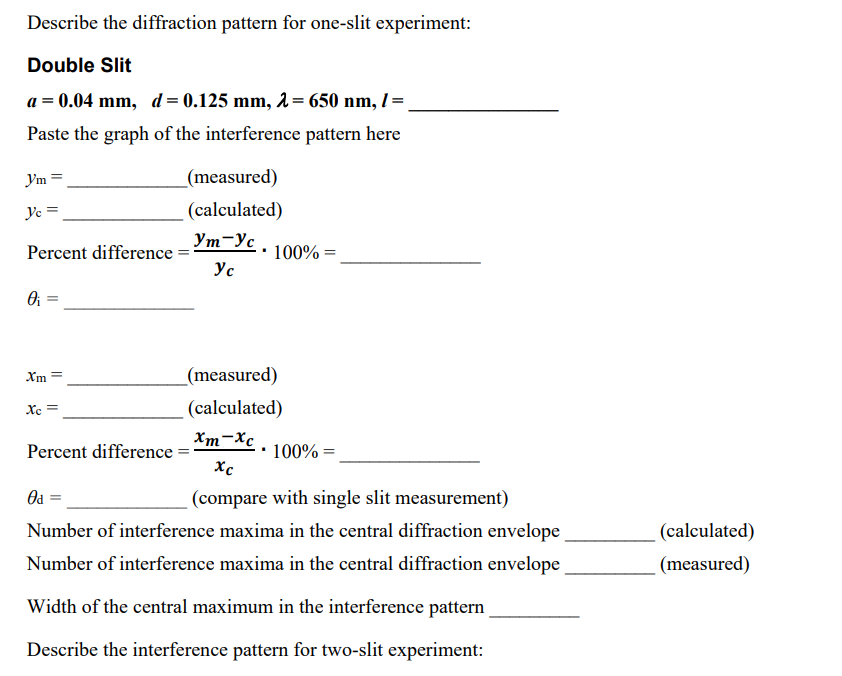
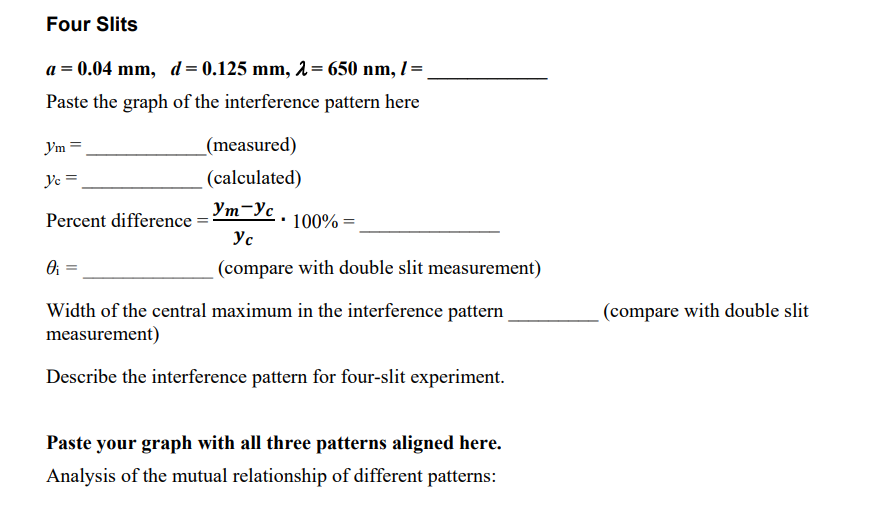
Diffraction and Interference X Tools Displays x W Hardware Light Intensity, ChA -7.41 cm, 82., A=3.70cm Graph Setup 80 Run #1 Table Data 1.23 Summary 70 Digits -7.32 cm, 77.83 % Calibration Scope 60 Calculator EFT Signal 50 Meter Generator A=-0.41cm Bar Meter Light Intensity, ChA (%) Code 40 Histogram 30 Circuit A=-75.82% Video 20 Analysis -7.73 cm, 2.01 % Image 10 Movie 0 A Text Box A=0.13cm Text Entry -17 -16 -15 -14 -13 -12 -11 -10 -9 -8 -7 -6 -5 -4 -3 -2 -1 Box Position (cm) Placeholder Controls x 00:00.00 Rotary Motion Sensor 100.00 Hz Record Continuous Mode Recording Conditions Delete Last RunDiffraction and Interference x O Displays x W Light Intensity, ChA Graph 80 Run #3 Table 1.23 70 Digits Scope 60 FFT 50 Meter -9.44 cm, 27.92 % Bar Meter A Light Intensity, ChA (%) 40 -9.33 cm, 2.64 % O A=-0.27cm Histogram 30 Hey Circuit A=1.65% Video 20 A=0.38cm A=4.50cm Analysis -9.71 cm, 0.99 % Image 10 Movie A Text Box 4=-26.93% Text Entry -17 -16 -15 14 -13 -12 -11 -10 -9 -8 -7 -6 -5 -4 -3 -2 -1 0 Box Position (cm) Placeholder O O Controls x 00:00.00 Rotary Motion Sensor v 100.00 Hz Recording Delete|Diffraction and Interference X O O Displays F . H. A . DE . AX - AA- NY NEXLAGO W dware Light Intensity, ChA Graph etup 60 Run #4 Table 55 ata -9.92 cm, 59.16 % 1.23 nmary 50 Digits ration 45 -9.74 cm, 3.20 % Scope A=5.18cm ulator 40 FFT gnal Meter erator 35 - - Bar Mete Light Intensity, ChA (%) 30 -10.04 cm, 4.49 % 4=-2.49cm ode O O 25 Histogram HF 20 Circuit 15 A=0.31cm A=-1.29% Video Analysis 10 Image 5 Movie A u O Text Box Text Entry -18 -17 -16 -15 -14 -13 -12 -11 -10 -9 -8 -7 -6 -5 -4 -3 -2 -1 0 Box Position (cm) Placeholde O O Controls x 00:00.00 Rotary Motion Sensor 100.00 Hz Continu Recording DeleteSingle slit: a = 0.04 mm, 1 = 650 nm, / = Paste the graph of the diffraction pattern here Xm = (measured) Xc = (calculated) Percent difference = Xm XC - 100% = Xc Od =Describe the diffraction pattern for oneslit experiment: Double Slit a = 0.04 mm1 ff= 0.125 mm, .1 = 650 nm, .l'= Paste the graph of the interference pattern here ym = {measured} ya = (calculated) Percent difference = ymyc ' 100% = 3': Hi M1 = {measured} x: = (calculated) .7: x Percent difference = mx C 100% = C 8.1 (compare with single slit measurement) Number of interference maxima in the central diffraction envelope (calculated) Number of interference maxima in the central diffraction envelope (measured) 1Width of the central maximum in the interference pattern Describe the interference pattern for twoslit experiment: Four Slits a= 0.04 mm1 d= 0.125 mm, ,1 = 650 um, f= Paste the graph of the interference pattern here ym = {measured} ya = (calculated) Percent difference = J'mJ'c ' 100% = yr: :3 (compare with double slit measurement) Width of the central maximum in the interference pattern (compare with double slit measurement) Describe the interference pattern for fourslit experiment. Paste your graph with all three patterns aligned here. Analysis cfthc mutual relationship of different patterns
Step by Step Solution
There are 3 Steps involved in it

Get step-by-step solutions from verified subject matter experts