

Question: Could somebody help me with this? What did I do wrong? I have included all instructions and numbers. My word is shown in the Excel
Could somebody help me with this? What did I do wrong? I have included all instructions and numbers. My word is shown in the Excel pictures.
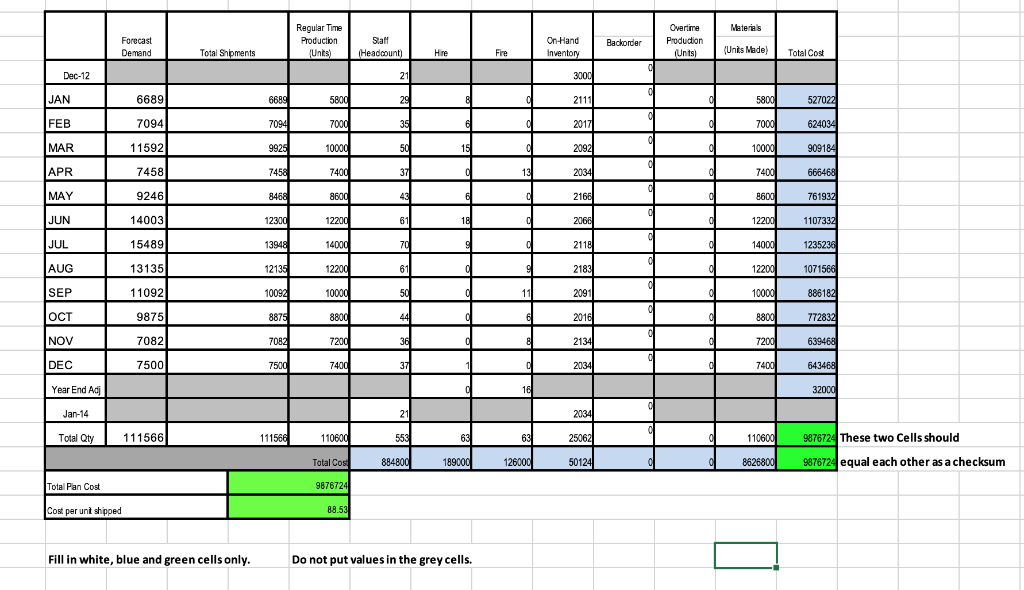
^This is my Chase plan
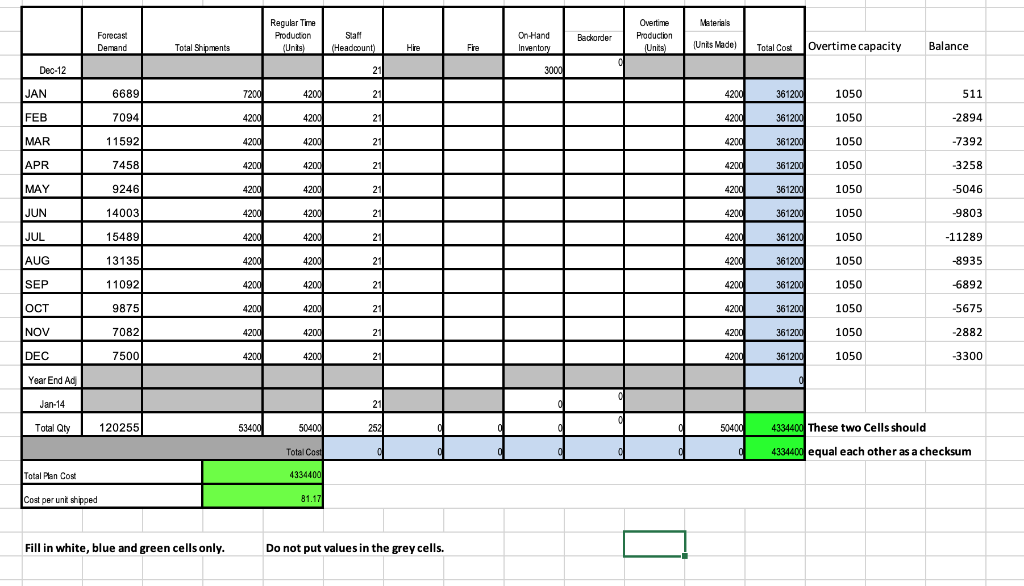
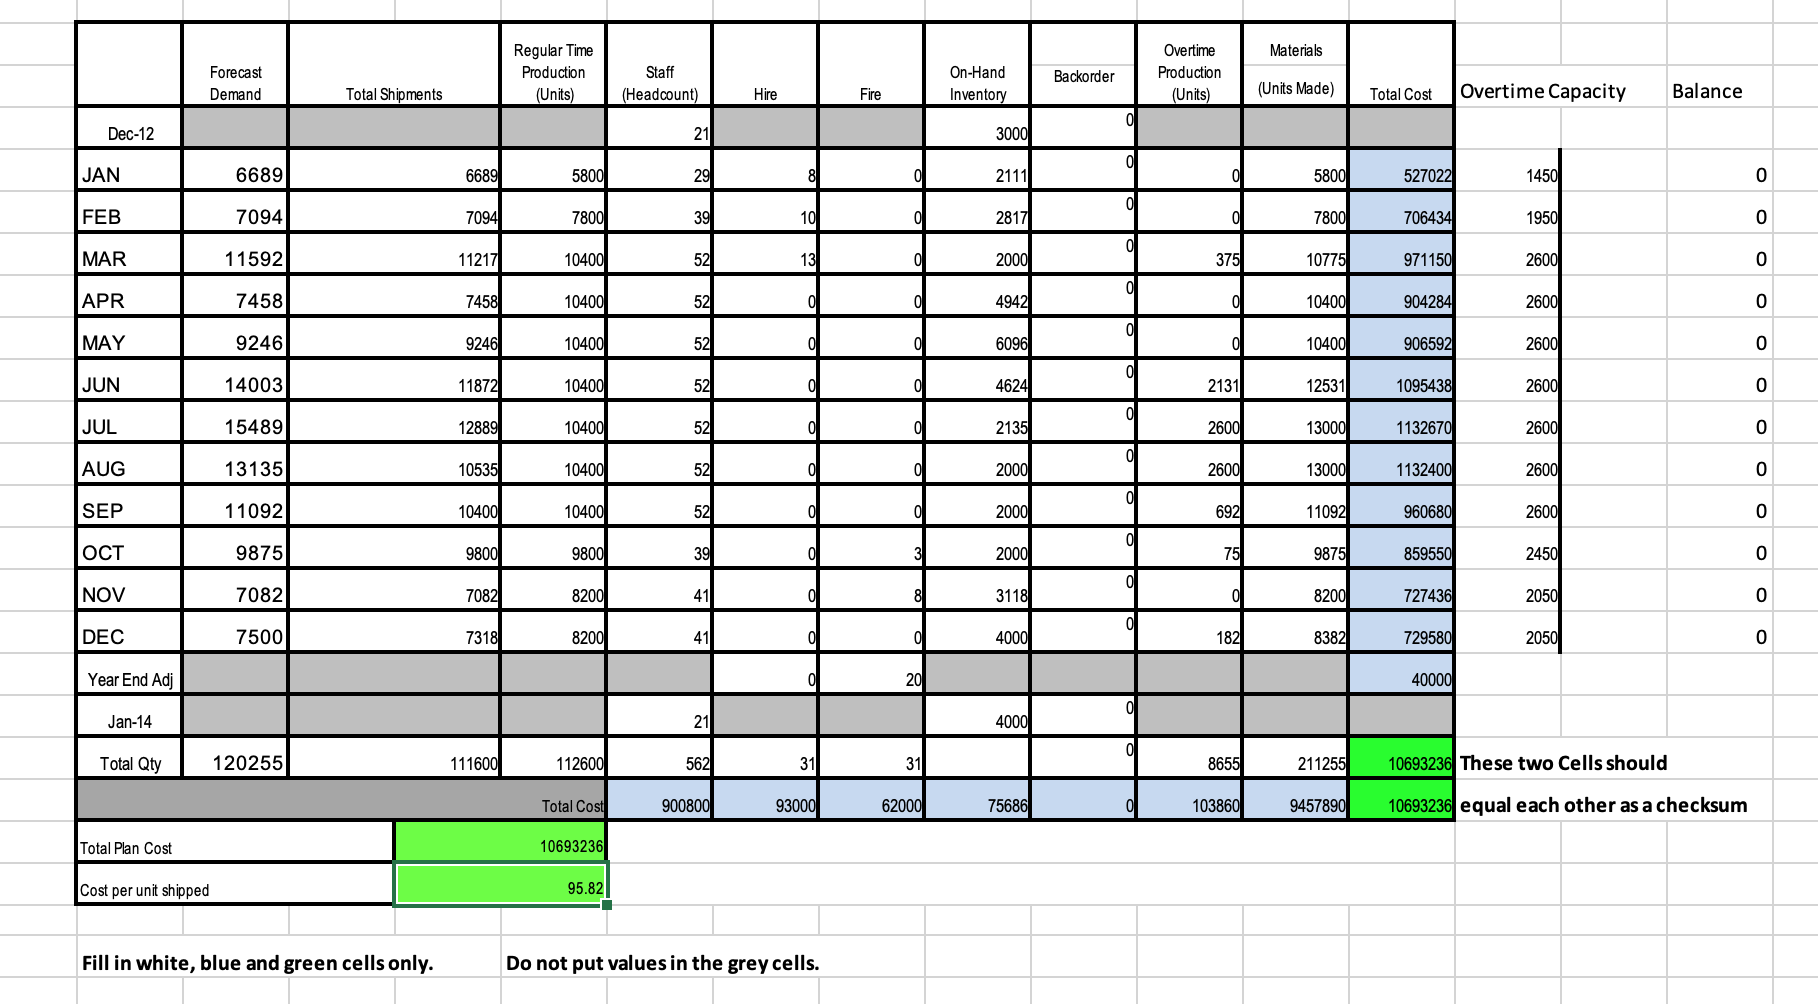 My level-utilization and mixed plan
Could you Rewrite another excel document showing each plan? Would really appreciate it. I am having a hard time getting it right.
Will Rate!
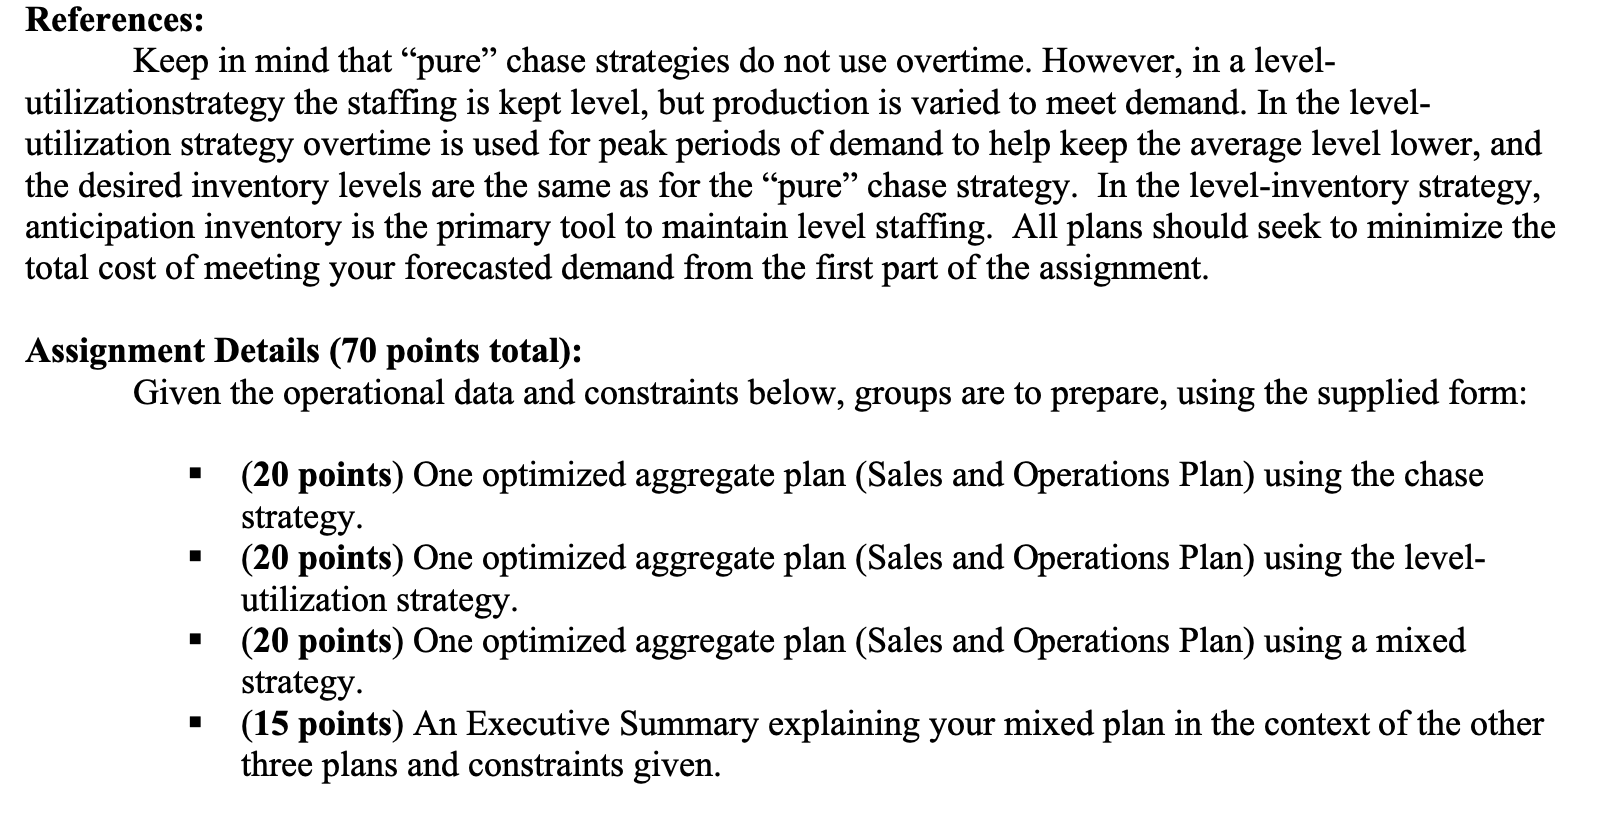
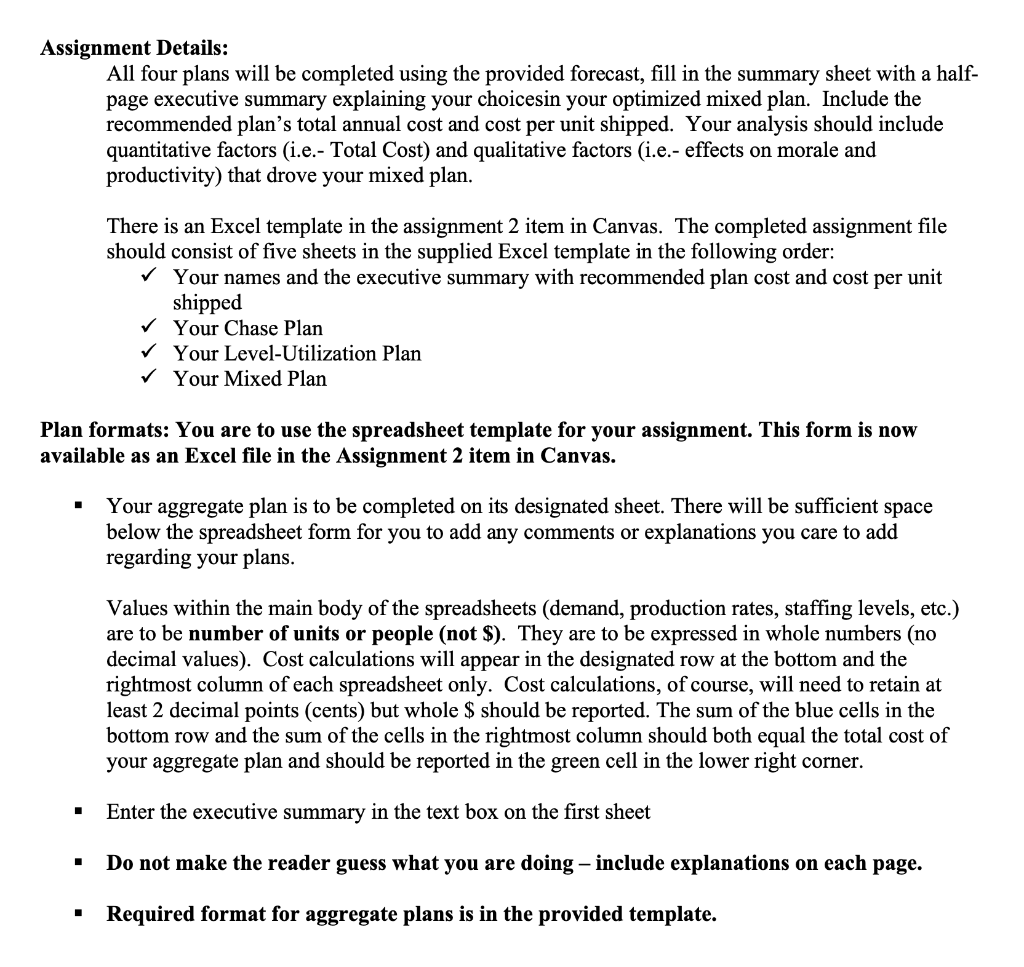
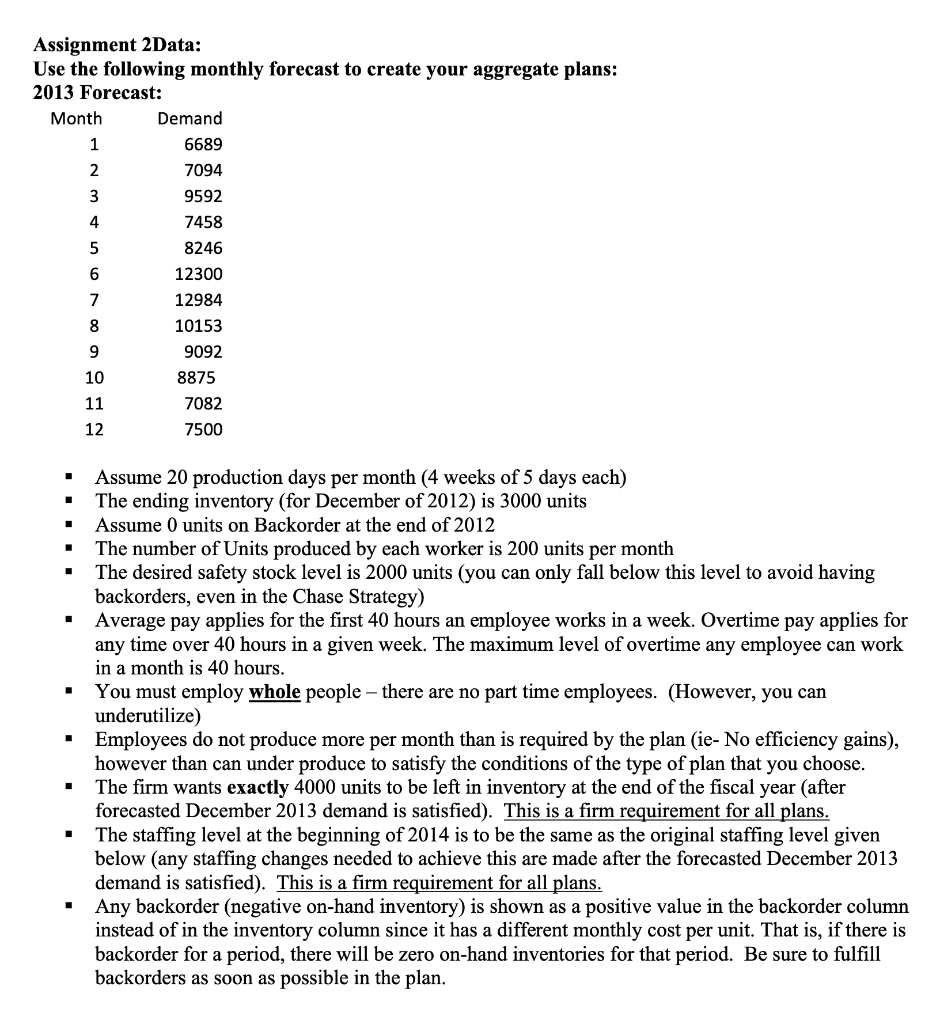
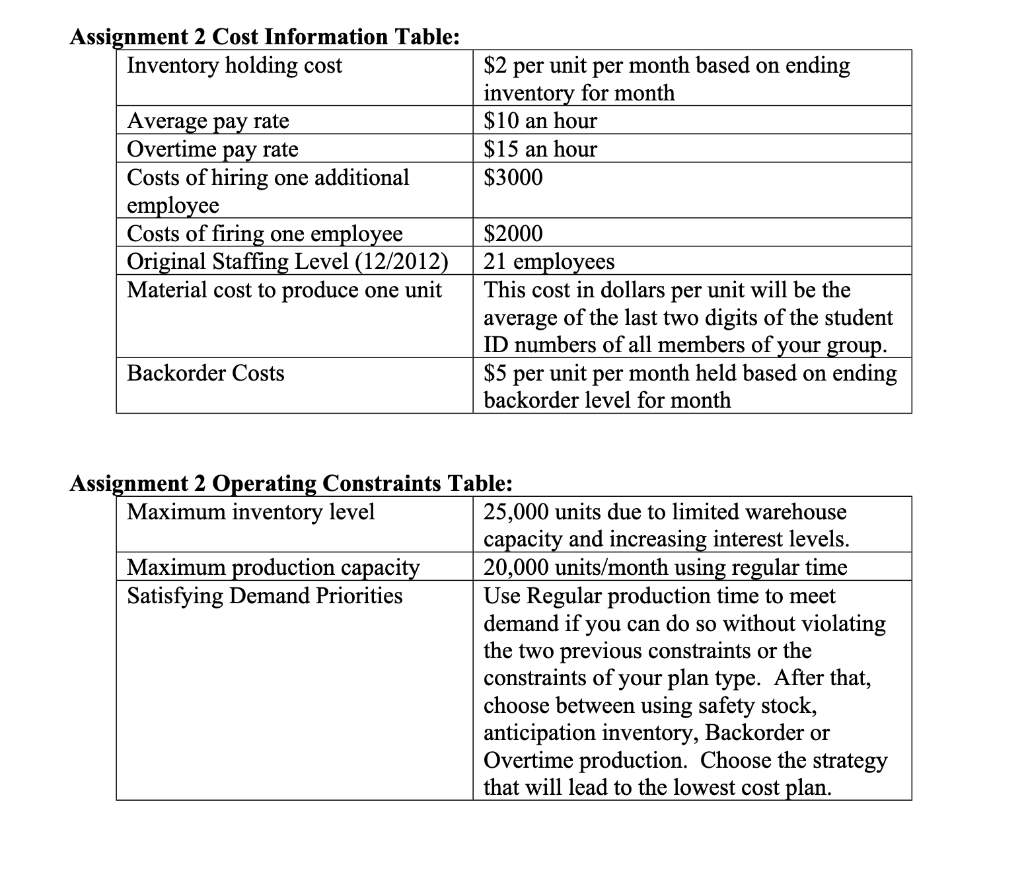
References: Keep in mind that pure chase strategies do not use overtime. However, in a level- utilizationstrategy the staffing is kept level, but production is varied to meet demand. In the level- utilization strategy overtime is used for peak periods of demand to help keep the average level lower, and the desired inventory levels are the same as for the pure chase strategy. In the level-inventory strategy, anticipation inventory is the primary tool to maintain level staffing. All plans should seek to minimize the total cost of meeting your forecasted demand from the first part of the assignment. Assignment Details (70 points total): Given the operational data and constraints below, groups are to prepare, using the supplied form: 1 (20 points) One optimized aggregate plan (Sales and Operations Plan) using the chase strategy. (20 points) One optimized aggregate plan (Sales and Operations Plan) using the level- utilization strategy. (20 points) One optimized aggregate plan (Sales and Operations Plan) using a mixed strategy. (15 points) An Executive Summary explaining your mixed plan in the context of the other three plans and constraints given. Assignment Details: All four plans will be completed using the provided forecast, fill in the summary sheet with a half- page executive summary explaining your choicesin your optimized mixed plan. Include the recommended plan's total annual cost and cost per unit shipped. Your analysis should include quantitative factors (i.e.- Total Cost) and qualitative factors (i.e.- effects on morale and productivity) that drove your mixed plan. There is an Excel template in the assignment 2 item in Canvas. The completed assignment file should consist of five sheets in the supplied Excel template in the following order: Your names and the executive summary with recommended plan cost and cost per unit shipped Your Chase Plan Your Level-Utilization Plan Your Mixed Plan Plan formats: You are to use the spreadsheet template for your assignment. This form is now available as an Excel file in the Assignment 2 item in Canvas. Your aggregate plan is to be completed on its designated sheet. There will be sufficient space below the spreadsheet form for you to add any comments or explanations you care to add regarding your plans. Values within the main body of the spreadsheets (demand, production rates, staffing levels, etc.) are to be number of units or people (not $). They are to be expressed in whole numbers (no decimal values). Cost calculations will appear in the designated row at the bottom and the rightmost column of each spreadsheet only. Cost calculations, of course, will need to retain at least 2 decimal points (cents) but whole $ should be reported. The sum of the blue cells in the bottom row and the sum of the cells in the rightmost column should both equal the total cost of your aggregate plan and should be reported in the green cell in the lower right corner. Enter the executive summary in the text box on the first sheet Do not make the reader guess what you are doing - include explanations on each page. Required format for aggregate plans is in the provided template. Assignment 2Data: Use the following monthly forecast to create your aggregate plans: 2013 Forecast: Month Demand 1 6689 2 7094 3 9592 4 7458 5 6 12300 7 12984 8 10153 9 9092 10 8875 11 7082 12 7500 8246 1 Assume 20 production days per month (4 weeks of 5 days each) The ending inventory (for December of 2012) is 3000 units Assume 0 units on Backorder at the end of 2012 The number of Units produced by each worker is 200 units per month The desired safety stock level is 2000 units (you can only fall below this level to avoid having backorders, even in the Chase Strategy) Average pay applies for the first 40 hours an employee works in a week. Overtime pay applies for any time over 40 hours in a given week. The maximum level of overtime any employee can work in a month is 40 hours. You must employ whole people there are no part time employees. (However, you can underutilize) Employees do not produce more per month than is required by the plan (ie- No efficiency gains), however than can under produce to satisfy the conditions of the type of plan that you choose. The firm wants exactly 4000 units to be left in inventory at the end of the fiscal year (after forecasted December 2013 demand is satisfied). This is a firm requirement for all plans. The staffing level at the beginning of 2014 is to be the same as the original staffing level given below (any staffing changes needed to achieve this are made after the forecasted December 2013 demand is satisfied). This is a firm requirement for all plans. Any backorder (negative on-hand inventory) is shown as a positive value in the backorder column instead of in the inventory column since it has a different monthly cost per unit. That is, if there is backorder for a period, there will be zero on-hand inventories for that period. Be sure to fulfill backorders as soon as possible in the plan. 1 Assignment 2 Cost Information Table: Inventory holding cost $2 per unit per month based on ending inventory for month $10 an hour $15 an hour $3000 Average pay rate Overtime pay rate Costs of hiring one additional employee Costs of firing one employee Original Staffing Level (12/2012) Material cost to produce one unit $2000 21 employees This cost in dollars per unit will be the average of the last two digits of the student ID numbers of all members of your group. $5 per unit per month held based on ending backorder level for month Backorder Costs Assignment 2 Operating Constraints Table: Maximum inventory level 25,000 units due to limited warehouse capacity and increasing interest levels. Maximum production capacity 20,000 units/month using regular time Satisfying Demand Priorities Use Regular production time to meet demand if you can do so without violating the two previous constraints or the constraints of your plan type. After that, choose between using safety stock, anticipation inventory, Backorder or Overtime production. Choose the strategy that will lead to the lowest cost plan. Materials Regular Time Production Unts) Forecast Demand Salt (Headcount) Backorder Overtime Production (Unts) Total Shipments Hire On Hand Inventory Fire (Units Made) Total Cosi Dec-12 21 3000 JAN 6689 6689 5800 29 2111 0 5800 527022 FEB 7094 7094 7000 35 2017 7000 624034 MAR 11592 9925 10000 50 15 2092 10000 909184 APR 7458 7458 7400 37 13 2034 0 7400 666468 MAY 9246 8468 8600 43 2166 8600 761932 JUN 14003 12300 12200 61 1 2066 0 12200 1107332 JUL 15489 13948 14000 70 2118 0 14000 1235236 AUG 13135 12136 12200 61 2183 0 12200 1071566 SEP 11092 10092 10000 50 11 20911 0 10000 886182 OCT 9875 8875 8800 44 6 2016 0 88001 772832 NOV 7082 7082 7200 36 8 2134 0 7200 639468 DEC 7500 7500 7400 37 0 20341 7400 643469 Year End Adj 16 32000 Jan-14 21 2034 Total Qty 111566) 111566 110600 553 63 63 25062 0 110600 9876724 These two Cells should Total Cos 884800 189000 126000 50124 o 0 8626800 9876724 equal each other as a checksum Total Plan Cost 9876724 Cost per unit shipped 88.53 Fill in white, blue and green cells only. 0 Do not put values in the grey cells. Materials Regular Time Production (Units) Forecast Demand Backardes Slalt (Headcount) Overtime Production (Units) Total Shipments Hire On Hand Inventory Fire Units Medei Total Con Overtime capacity Balance Dec-12 21 3000 JAN 6689 7200 4200 21 4200 361200 1050 511 FEB 7094 4200 4200 21 4200 361200 1050 -2894 MAR 11592 4200 4200 21 4200 361200 1050 -7392 APR 7458 4200 4200 21 4200 361200 1050 -3258 MAY 9246 4200 4200 21 4200 361200 1050 -5046 JUN 14003 4200 4200 21 4200 361200 1050 -9803 JUL 15489 4200 4200 21 4200 361200 1050 -11289 AUG 13135 4200 4200 21 4200 361200 1050 -8935 SEP 11092 4200 4200 21 4200 361200 1050 -6892 OCT 9875 4200 4200 21 4200 361200 1050 -5675 NOV 7082 4200 4200 21 4200 361200 1050 -2882 DEC 7500 4200 4200 21 4200 361200 1050 -3300 Year End Ad Jan-14 21 Total Qty 120255 53400 50400 252 C 50400 4334400 These two Cells should Total Cost g 4334400 equal each other as a checksum Total Plan Cost 4334400 Cost per unit shipped 81.17 Fill in white, blue and green cells only. Do not put values in the grey cells. Materials Forecast Demand Regular Time Production (Units) Backorder Staff (Headcount) On-Hand Inventory Overtime Production (Units) Total Shipments Hire Fire (Units Made) Total Cost Overtime Capacity Balance 0 Dec-12 21 3000 0 JAN 6689 6689 5800 29 8 0 2111 5800 527022 1450 0 0 FEB 7094 7094 7800 39 10 0 2817 0 7800 706434 1950 0 0 MAR 11592 11217 10400 52 13 0 2000 375 10775 971150 2600 0 0 APR 7458 7458 10400 52 0 4942 0 10400 904284 2600 0 0 MAY 9246 9246 10400 52 0 0 6096 0 10400 906592 2600 0 0 JUN 14003 11872 10400 52 0 4624 2131 12531 1095438 2600 0 0 JUL 15489 12889 10400 52 0 0 2135 2600 13000 1132670 2600 0 0 AUG 13135 10535 10400 52 0 0 2000 2600 13000 1132400 2600 0 0 SEP 11092 10400 10400 52 0 0 2000 692 11092 960680 2600 0 0 OCT 9875 9800 9800 39 0 3 2000 75 9875 859550 2450 0 0 NOV 7082 7082 8200 411 8 3118 0 8200 727436 2050 0 0 DEC 7500 7318 8200 41 0 4000 182 8382 729580 2050 0 Year End Adj 0 20 40000 0 Jan-14 21 4000 0 Total Qty 120255 111600 112600 562 31 31 8655 211255 10693236 These two Cells should Total Cost 900800 93000 62000 75686 0 103860 9457890 10693236 equal each other as a checksum Total Plan Cost 10693236 Cost per unit shipped 95.82 Fill in white, blue and green cells only. Do not put values in the grey cells. References: Keep in mind that pure chase strategies do not use overtime. However, in a level- utilizationstrategy the staffing is kept level, but production is varied to meet demand. In the level- utilization strategy overtime is used for peak periods of demand to help keep the average level lower, and the desired inventory levels are the same as for the pure chase strategy. In the level-inventory strategy, anticipation inventory is the primary tool to maintain level staffing. All plans should seek to minimize the total cost of meeting your forecasted demand from the first part of the assignment. Assignment Details (70 points total): Given the operational data and constraints below, groups are to prepare, using the supplied form: 1 (20 points) One optimized aggregate plan (Sales and Operations Plan) using the chase strategy. (20 points) One optimized aggregate plan (Sales and Operations Plan) using the level- utilization strategy. (20 points) One optimized aggregate plan (Sales and Operations Plan) using a mixed strategy. (15 points) An Executive Summary explaining your mixed plan in the context of the other three plans and constraints given. Assignment Details: All four plans will be completed using the provided forecast, fill in the summary sheet with a half- page executive summary explaining your choicesin your optimized mixed plan. Include the recommended plan's total annual cost and cost per unit shipped. Your analysis should include quantitative factors (i.e.- Total Cost) and qualitative factors (i.e.- effects on morale and productivity) that drove your mixed plan. There is an Excel template in the assignment 2 item in Canvas. The completed assignment file should consist of five sheets in the supplied Excel template in the following order: Your names and the executive summary with recommended plan cost and cost per unit shipped Your Chase Plan Your Level-Utilization Plan Your Mixed Plan Plan formats: You are to use the spreadsheet template for your assignment. This form is now available as an Excel file in the Assignment 2 item in Canvas. Your aggregate plan is to be completed on its designated sheet. There will be sufficient space below the spreadsheet form for you to add any comments or explanations you care to add regarding your plans. Values within the main body of the spreadsheets (demand, production rates, staffing levels, etc.) are to be number of units or people (not $). They are to be expressed in whole numbers (no decimal values). Cost calculations will appear in the designated row at the bottom and the rightmost column of each spreadsheet only. Cost calculations, of course, will need to retain at least 2 decimal points (cents) but whole $ should be reported. The sum of the blue cells in the bottom row and the sum of the cells in the rightmost column should both equal the total cost of your aggregate plan and should be reported in the green cell in the lower right corner. Enter the executive summary in the text box on the first sheet Do not make the reader guess what you are doing - include explanations on each page. Required format for aggregate plans is in the provided template. Assignment 2Data: Use the following monthly forecast to create your aggregate plans: 2013 Forecast: Month Demand 1 6689 2 7094 3 9592 4 7458 5 6 12300 7 12984 8 10153 9 9092 10 8875 11 7082 12 7500 8246 1 Assume 20 production days per month (4 weeks of 5 days each) The ending inventory (for December of 2012) is 3000 units Assume 0 units on Backorder at the end of 2012 The number of Units produced by each worker is 200 units per month The desired safety stock level is 2000 units (you can only fall below this level to avoid having backorders, even in the Chase Strategy) Average pay applies for the first 40 hours an employee works in a week. Overtime pay applies for any time over 40 hours in a given week. The maximum level of overtime any employee can work in a month is 40 hours. You must employ whole people there are no part time employees. (However, you can underutilize) Employees do not produce more per month than is required by the plan (ie- No efficiency gains), however than can under produce to satisfy the conditions of the type of plan that you choose. The firm wants exactly 4000 units to be left in inventory at the end of the fiscal year (after forecasted December 2013 demand is satisfied). This is a firm requirement for all plans. The staffing level at the beginning of 2014 is to be the same as the original staffing level given below (any staffing changes needed to achieve this are made after the forecasted December 2013 demand is satisfied). This is a firm requirement for all plans. Any backorder (negative on-hand inventory) is shown as a positive value in the backorder column instead of in the inventory column since it has a different monthly cost per unit. That is, if there is backorder for a period, there will be zero on-hand inventories for that period. Be sure to fulfill backorders as soon as possible in the plan. 1 Assignment 2 Cost Information Table: Inventory holding cost $2 per unit per month based on ending inventory for month $10 an hour $15 an hour $3000 Average pay rate Overtime pay rate Costs of hiring one additional employee Costs of firing one employee Original Staffing Level (12/2012) Material cost to produce one unit $2000 21 employees This cost in dollars per unit will be the average of the last two digits of the student ID numbers of all members of your group. $5 per unit per month held based on ending backorder level for month Backorder Costs Assignment 2 Operating Constraints Table: Maximum inventory level 25,000 units due to limited warehouse capacity and increasing interest levels. Maximum production capacity 20,000 units/month using regular time Satisfying Demand Priorities Use Regular production time to meet demand if you can do so without violating the two previous constraints or the constraints of your plan type. After that, choose between using safety stock, anticipation inventory, Backorder or Overtime production. Choose the strategy that will lead to the lowest cost plan. Materials Regular Time Production Unts) Forecast Demand Salt (Headcount) Backorder Overtime Production (Unts) Total Shipments Hire On Hand Inventory Fire (Units Made) Total Cosi Dec-12 21 3000 JAN 6689 6689 5800 29 2111 0 5800 527022 FEB 7094 7094 7000 35 2017 7000 624034 MAR 11592 9925 10000 50 15 2092 10000 909184 APR 7458 7458 7400 37 13 2034 0 7400 666468 MAY 9246 8468 8600 43 2166 8600 761932 JUN 14003 12300 12200 61 1 2066 0 12200 1107332 JUL 15489 13948 14000 70 2118 0 14000 1235236 AUG 13135 12136 12200 61 2183 0 12200 1071566 SEP 11092 10092 10000 50 11 20911 0 10000 886182 OCT 9875 8875 8800 44 6 2016 0 88001 772832 NOV 7082 7082 7200 36 8 2134 0 7200 639468 DEC 7500 7500 7400 37 0 20341 7400 643469 Year End Adj 16 32000 Jan-14 21 2034 Total Qty 111566) 111566 110600 553 63 63 25062 0 110600 9876724 These two Cells should Total Cos 884800 189000 126000 50124 o 0 8626800 9876724 equal each other as a checksum Total Plan Cost 9876724 Cost per unit shipped 88.53 Fill in white, blue and green cells only. 0 Do not put values in the grey cells. Materials Regular Time Production (Units) Forecast Demand Backardes Slalt (Headcount) Overtime Production (Units) Total Shipments Hire On Hand Inventory Fire Units Medei Total Con Overtime capacity Balance Dec-12 21 3000 JAN 6689 7200 4200 21 4200 361200 1050 511 FEB 7094 4200 4200 21 4200 361200 1050 -2894 MAR 11592 4200 4200 21 4200 361200 1050 -7392 APR 7458 4200 4200 21 4200 361200 1050 -3258 MAY 9246 4200 4200 21 4200 361200 1050 -5046 JUN 14003 4200 4200 21 4200 361200 1050 -9803 JUL 15489 4200 4200 21 4200 361200 1050 -11289 AUG 13135 4200 4200 21 4200 361200 1050 -8935 SEP 11092 4200 4200 21 4200 361200 1050 -6892 OCT 9875 4200 4200 21 4200 361200 1050 -5675 NOV 7082 4200 4200 21 4200 361200 1050 -2882 DEC 7500 4200 4200 21 4200 361200 1050 -3300 Year End Ad Jan-14 21 Total Qty 120255 53400 50400 252 C 50400 4334400 These two Cells should Total Cost g 4334400 equal each other as a checksum Total Plan Cost 4334400 Cost per unit shipped 81.17 Fill in white, blue and green cells only. Do not put values in the grey cells. Materials Forecast Demand Regular Time Production (Units) Backorder Staff (Headcount) On-Hand Inventory Overtime Production (Units) Total Shipments Hire Fire (Units Made) Total Cost Overtime Capacity Balance 0 Dec-12 21 3000 0 JAN 6689 6689 5800 29 8 0 2111 5800 527022 1450 0 0 FEB 7094 7094 7800 39 10 0 2817 0 7800 706434 1950 0 0 MAR 11592 11217 10400 52 13 0 2000 375 10775 971150 2600 0 0 APR 7458 7458 10400 52 0 4942 0 10400 904284 2600 0 0 MAY 9246 9246 10400 52 0 0 6096 0 10400 906592 2600 0 0 JUN 14003 11872 10400 52 0 4624 2131 12531 1095438 2600 0 0 JUL 15489 12889 10400 52 0 0 2135 2600 13000 1132670 2600 0 0 AUG 13135 10535 10400 52 0 0 2000 2600 13000 1132400 2600 0 0 SEP 11092 10400 10400 52 0 0 2000 692 11092 960680 2600 0 0 OCT 9875 9800 9800 39 0 3 2000 75 9875 859550 2450 0 0 NOV 7082 7082 8200 411 8 3118 0 8200 727436 2050 0 0 DEC 7500 7318 8200 41 0 4000 182 8382 729580 2050 0 Year End Adj 0 20 40000 0 Jan-14 21 4000 0 Total Qty 120255 111600 112600 562 31 31 8655 211255 10693236 These two Cells should Total Cost 900800 93000 62000 75686 0 103860 9457890 10693236 equal each other as a checksum Total Plan Cost 10693236 Cost per unit shipped 95.82 Fill in white, blue and green cells only. Do not put values in the grey cellsStep by Step Solution
There are 3 Steps involved in it
1 Expert Approved Answer
Step: 1 Unlock

Question Has Been Solved by an Expert!
Get step-by-step solutions from verified subject matter experts
Step: 2 Unlock
Step: 3 Unlock