

Question: Could someone help me with this exercise using excel? Please provide steps 5) Below are the test scores of 10 students (10 pts) a. Create
Could someone help me with this exercise using excel?
Please provide steps
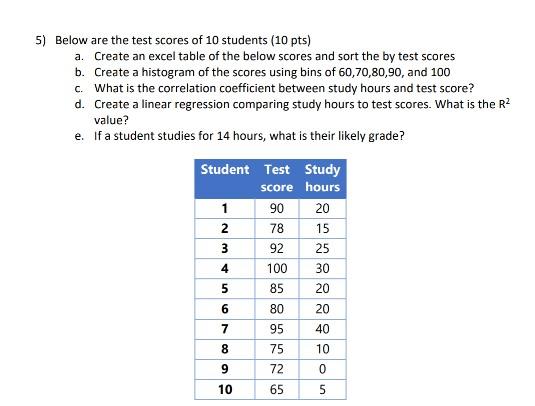
5) Below are the test scores of 10 students (10 pts) a. Create an excel table of the below scores and sort the by test scores b. Create a histogram of the scores using bins of 60,70,80,90, and 100 c. What is the correlation coefficient between study hours and test score? d. Create a linear regression comparing study hours to test scores. What is the R2 value? e. If a student studies for 14 hours, what is their likely grade? Student Test Study score hours 1 90 20 2 78 15 3 92 25 4 100 30 5 85 20 80 20 7 95 40 75 9 72 0 10 65 5 6 8
Step by Step Solution
There are 3 Steps involved in it
1 Expert Approved Answer
Step: 1 Unlock

Question Has Been Solved by an Expert!
Get step-by-step solutions from verified subject matter experts
Step: 2 Unlock
Step: 3 Unlock