

Question: Could someone help me with this pharmacokinetics assignment? How do I draw the appropriate graph and especially how do I make the calculations and what
Could someone help me with this pharmacokinetics assignment?
How do I draw the appropriate graph and especially how do I make the calculations and what formulas are used?
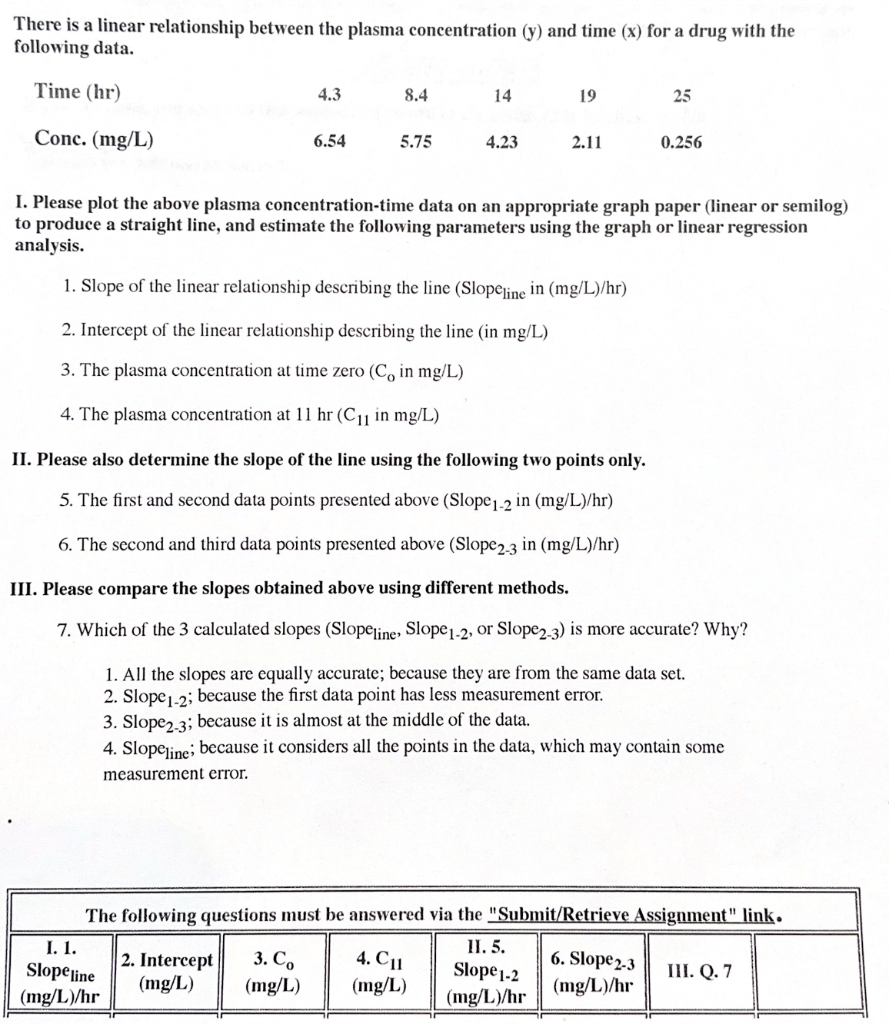
There is a linear relationship between the plasma concentration (y) and time (x) for a drug with the following data. I. Please plot the above plasma concentration-time data on an appropriate graph paper (linear or semilog) to produce a straight line, and estimate the following parameters using the graph or linear regression analysis. 1. Slope of the linear relationship describing the line (Slope line in (mg/L)/hr) 2. Intercept of the linear relationship describing the line (in mg/L ) 3. The plasma concentration at time zero (Co in mg/L) 4. The plasma concentration at 11hr(C11 in mg/L) II. Please also determine the slope of the line using the following two points only. 5. The first and second data points presented above (Slope12in(mg/L)/hr) 6. The second and third data points presented above (Slope23 in (mg/L)/hr) III. Please compare the slopes obtained above using different methods. 7. Which of the 3 calculated slopes (Slope line Slope 12, or Slope 23 ) is more accurate? Why? 1. All the slopes are equally accurate; because they are from the same data set. 2. Slope 12; because the first data point has less measurement error. 3. Slope 23; because it is almost at the middle of the data. measurement error
Step by Step Solution
There are 3 Steps involved in it

Get step-by-step solutions from verified subject matter experts