

Question: Could someone help with D through F? I have no idea what I'm doing wrong. I'll make sure to upvote but pls only answer if
Could someone help with D through F? I have no idea what I'm doing wrong. I'll make sure to upvote but pls only answer if you're confident you know how. Thanks :-)
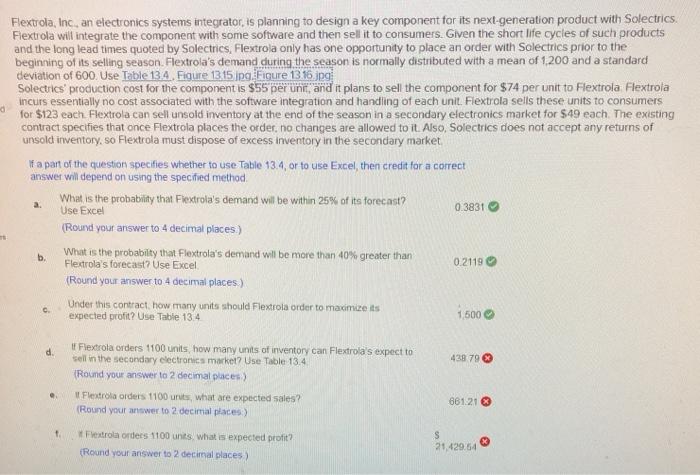
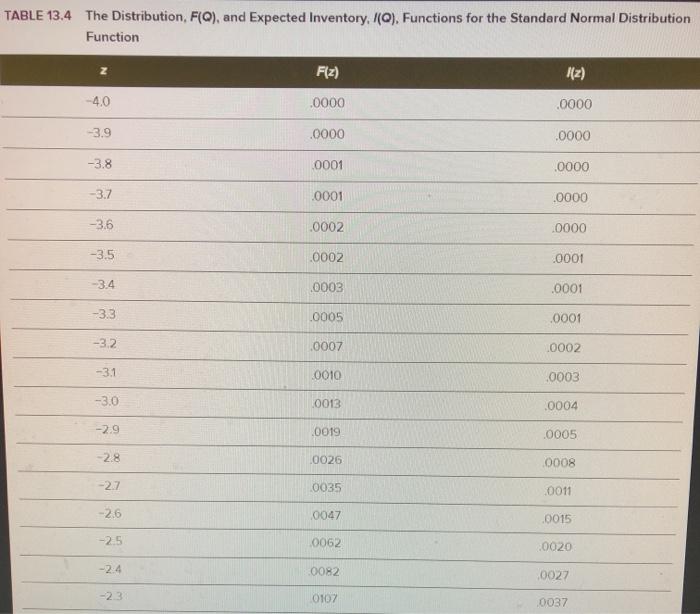
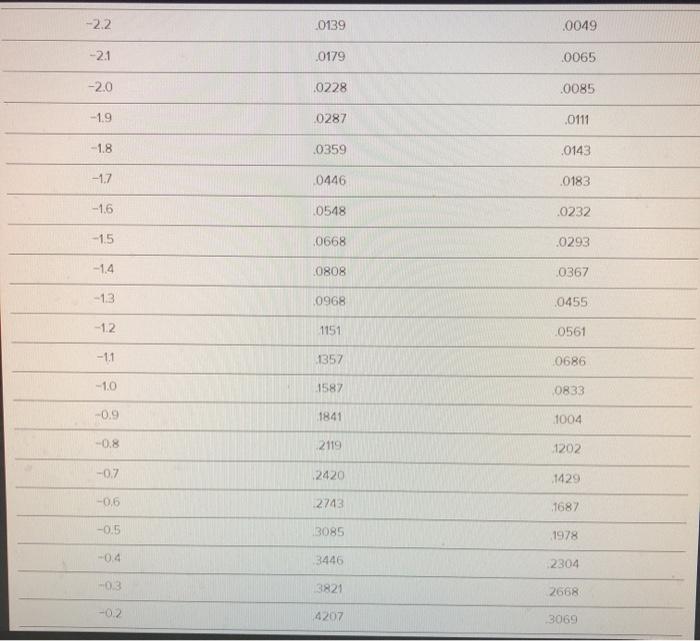
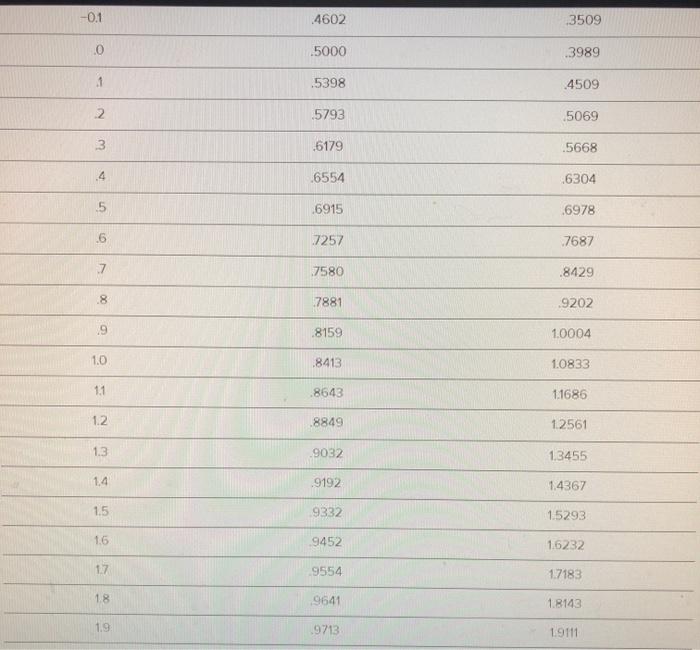
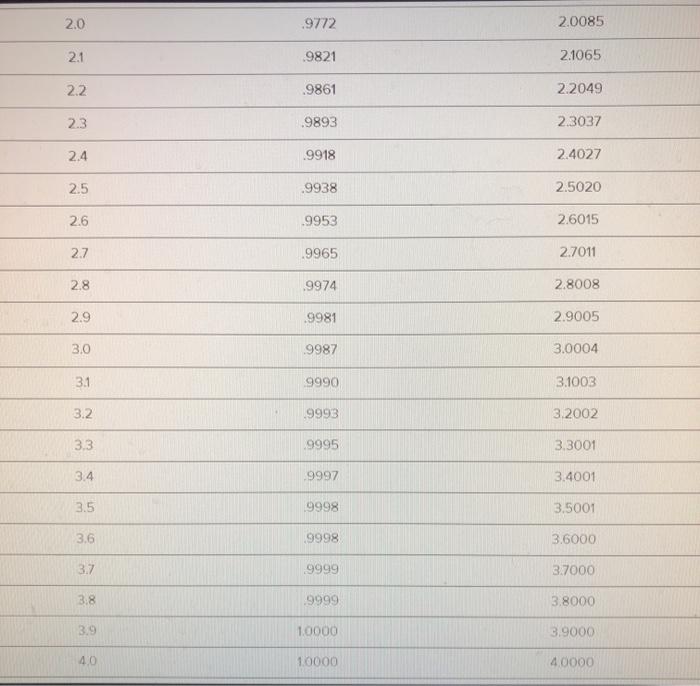
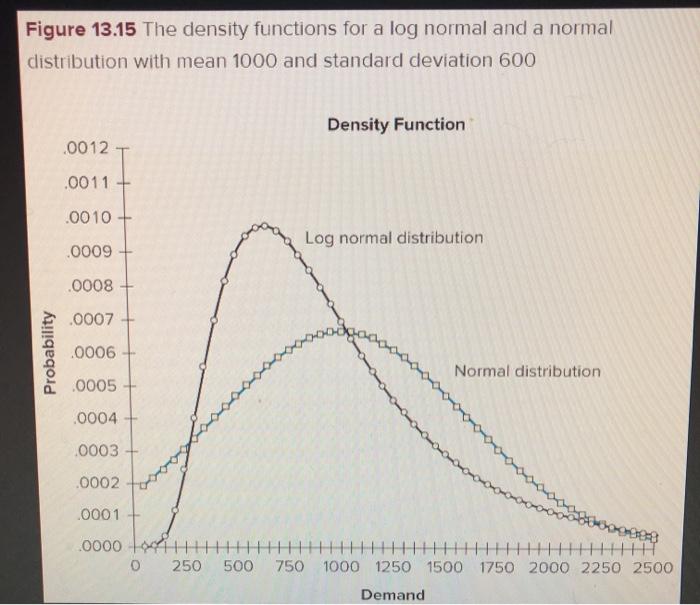
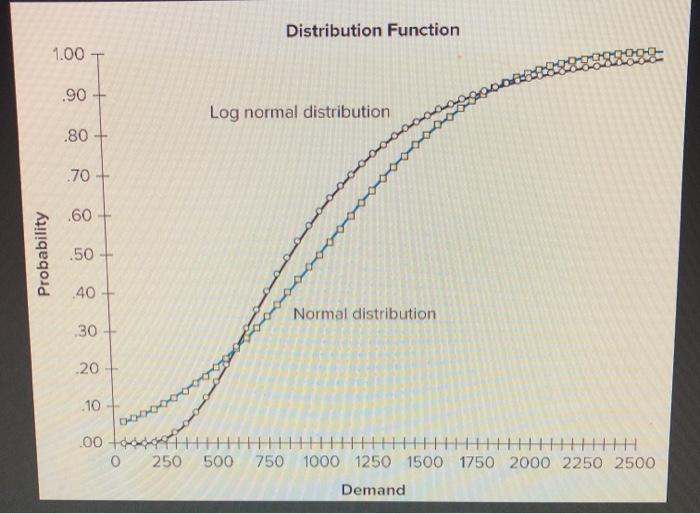
d Flextrola, Inc an electronics systems integrator, is planning to design a key component for its next-generation product with Solectrics. Flextrola will integrate the component with some software and then sell it to consumers. Given the short life cycles of such products and the long lead times quoted by Solectrics, Flextrola only has one opportunity to place an order with Solectrics prior to the beginning of its selling season Flextrola's demand during the season is normally distributed with a mean of 1.200 and a standard deviation of 600. Use Table 134. Figure 13.15 ing. Figure 1316.jpg Solectrics' production cost for the component is $55 per unre, and it plans to sell the component for $74 per unit to Flextrola Flextroja incurs essentially no cost associated with the software integration and handling of each unit Flextrola sells these units to consumers for $123 each Flextrola can sell unsold inventory at the end of the season in a secondary electronics market for $49 each The existing contract specifies that once Flextrola places the order no changes are allowed to it. Also, Solectrics does not accept any returns of unsold inwentory, so Flextrola must dispose of excess inventory in the secondary market of a part of the question specifies whether to use Table 13.4 or to use Excel, then credit for a correct answer will depend on using the specified method What is the probability that Fiextrola's demand will be within 25% of its forecast? 0.3831 (Round your answer to 4 decimal places) What is the probability that Flextrola's demand will be more than 40% greater than Flextrola's forecast? Use Excel 02119 (Round your answer to 4 decimal places) Under this contract how many units should Flextrola order to maximize its expected profit? Use Table 134 1500 Use Excel b. c. d 438.79 Flextrola orders 1100 units, how many units of inventory can Flextrola's expect to sell in the secondary electronics market? Use Table 13.4 Round your answer to 2 decimal puces > Flextrola ordets 1100 units what are expected sales? (Round your answer to 2 decimal places) 661.213 Flextrola orders 1100 units. What is expected profit? Round your answer to 2 decimal places) 21.429.54 TABLE 13.4 The Distribution, F(Q), and Expected Inventory. I(Q), Functions for the Standard Normal Distribution Function Z F(z) -4.0 .0000 .0000 -3.9 .0000 ,0000 -3.8 0001 .0000 -3.7 0001 .0000 -3.6 .0002 10000 -3.5 .0002 .0001 -3.4 0003 .0001 -3.3 .0005 .0001 -3.2 0007 L0002 -31 0010 0003 -3.0 0013 0004 -2.9 .0019 .0005 -2.8 0026 0008 -2.7 0035 0011 -2.6 0047 0015 -2.5 0062 20020 0082 0027 -23 0107 0087 -2.2 0139 .0049 -2.1 0179 .0065 -2.0 0228 0085 -19 0287 0111 -1.8 0359 0143 -17 0446 .0183 - 1.6 0548 0232 -15 0668 .0293 -1.4 0808 0367 -13 0968 0455 -1.2 1151 0561 -11 1357 0686 -1.0 1587 0833 -0.9 1841 1004 -0.8 2119 1202 -0.7 2420 1429 -0.6 2743 1687 -0.5 13085 1978 -0.4 3446 2304 -03 3821 2668 -0.2 4207 3069 -0.1 4602 3509 .0 5000 .3989 1 .5398 .4509 2 5793 5069 3 6179 5668 4 .6554 .6304 15 .6915 .6978 .6 7257 7687 7 7580 .8429 .8 .7881 9202 9 8159 1.0004 1.0 .8413 1.0833 1.1 8643 1.1686 1.2 .8849 12561 1.3 9032 1.3455 1.4 9192 1.4367 1.5 9332 1.5293 1.6 9452 1.6232 1.7 9554 1.7183 1.8 9641 1.8143 1.9 9713 19111 2.0 9772 2.0085 2.1 9821 2.1065 2.2 .9861 2.2049 2.3 .9893 2.3037 2.4 .9918 2.4027 2.5 .9938 2.5020 2.6 .9953 2.6015 2.7 .9965 2.7011 2.8 19974 2.8008 2.9 .9981 2.9005 3.0 9987 3.0004 3.1 9990 3.1003 3.2 9993 3.2002 3.3 9995 3.3001 3.4 .9997 3.4001 3.5 9998 3,5001 3.6 9998 3.6000 3.7 9999 3.7000 3.8 9999 3.8000 3.9 1.0000 3.9000 40 1.0000 4.0000 Figure 13.15 The density functions for a log normal and a normal distribution with mean 1000 and standard deviation 600 Density Function .0012 .0011 .0010 Log normal distribution .0009 - .0008 .0007 Probability .0006 Normal distribution .0005 0004 .0003 .0002 .0001 .0000HHHHHHHHHHHHHHHHHHHHHHHH HH 0 250 500 750 1000 1250 1500 1750 2000 2250 2500 Demand Distribution Function 1.00 T .90 Log normal distribution .80 .70 .60+ Probability .50 - .40 Normal distribution 30 20 10 .00 to 11 o 250 500 HHHHHHHHHHHHHH 750 1000 1250 1500 1750 2000 2250 2500 Demand Step by Step Solution
There are 3 Steps involved in it
1 Expert Approved Answer
Step: 1 Unlock

Question Has Been Solved by an Expert!
Get step-by-step solutions from verified subject matter experts
Step: 2 Unlock
Step: 3 Unlock