

Question: could someone help with this project? In Project Two, you will analyze and evaluate a business's financial health and recommend the best financing options for
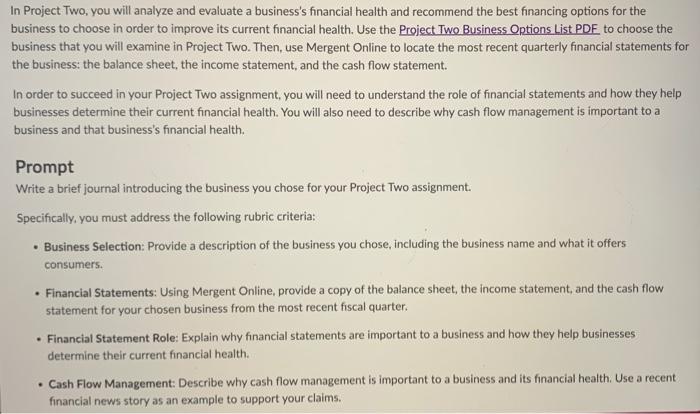
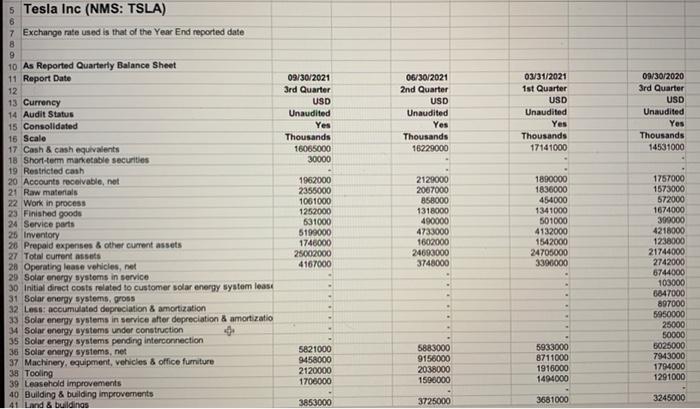

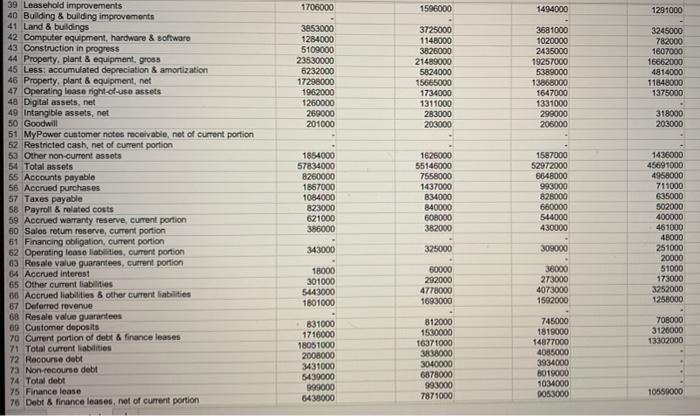
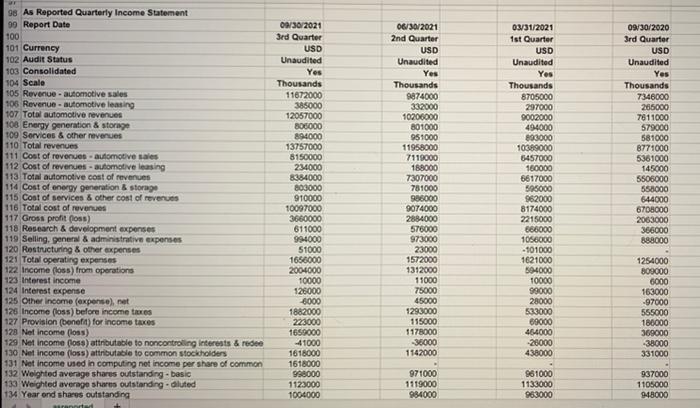
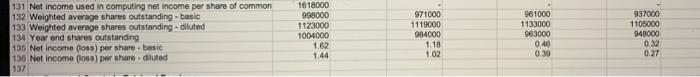
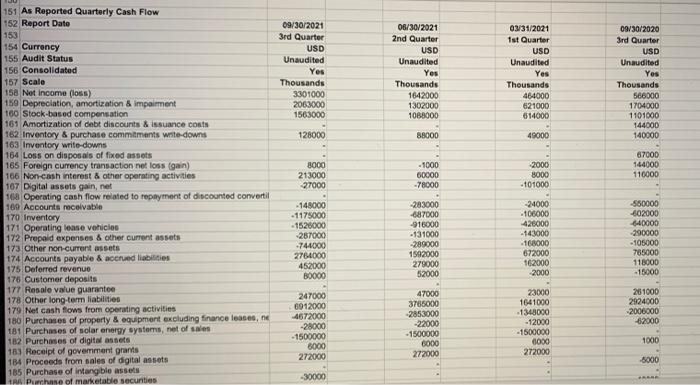
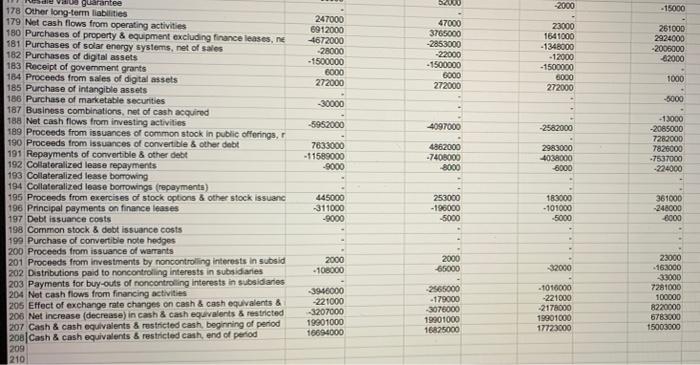
In Project Two, you will analyze and evaluate a business's financial health and recommend the best financing options for the business to choose in order to improve its current financial health. Use the Project Two Business Options List PDF to choose the business that you will examine in Project Two. Then, use Mergent Online to locate the most recent quarterly financial statements for the business: the balance sheet, the income statement, and the cash flow statement In order to succeed in your Project Two assignment, you will need to understand the role of financial statements and how they help businesses determine their current financial health. You will also need to describe why cash flow management is important to a business and that business's financial health. Prompt Write a brief journal introducing the business you chose for your Project Two assignment. Specifically, you must address the following rubric criteria: Business Selection: Provide a description of the business you chose, including the business name and what it offers consumers. Financial Statements: Using Mergent Online, provide a copy of the balance sheet, the income statement, and the cash flow statement for your chosen business from the most recent fiscal quarter. Financial Statement Role: Explain why financial statements are important to a business and how they help businesses determine their current financial health. Cash Flow Management: Describe why cash flow management is important to a business and its financial health. Use a recent financial news story as an example to support your claims. . 06/30/2021 2nd Quarter USD Unaudited 09/30/2021 3rd Quarter USD Unaudited Yes Thousands 16065000 30000 03/31/2021 1st Quarter USD Unaudited Yes Thousands 17141000 09/30/2020 3rd Quarter USD Unaudited Yes Thousands 14531000 Yes Thousands 16229000 s Tesla Inc (NMS: TSLA) 6 7 Exchange rate used is that of the Year End reported date 8 9 10 As Reported Quarterly Balance Sheet 11 Report Date 12 13 Currency 14 Audit Status 15 Consolidated 15 Scale 17 Cash & cash equivalents 18 Short-term marketable securities 19 Restricted cash 20 Accounts receivable, net 21 Raw materials 22 Work in process 23 Finished goods 24 Service parts 26 Inventory 20 Prepaid expenses & other current assets 27 Total current assets 28 Operating lease vehicles, net 29 Solar energy systems in service 30 Initial direct costs related to customer solar energy system lease 31 Solar energy systems, gross 32 Loss: accumulated depreciation & amortization 33 Solar energy systems in service after depreciation & amortizatio 34 Solar energy systems under construction 35 Solar energy systems pending Interconnection 36 Solar energy systems, net 37 Machinery, equipment, vehicles & office furniture 38 Tooling 39 Leasehold Improvements 40 Building & building improvements 41 Land & buildings 1962000 2355000 1061000 1252000 631000 5199000 1746000 25002000 4167000 2129000 2007000 858000 1318000 490000 4733000 1602000 24693000 3748000 1890000 1836000 454000 1341000 501000 413200 1542000 24705000 3390000 1757000 1573000 572000 1674000 399000 4216000 1238000 21744000 2742000 6744000 103000 5847000 897000 5950000 25000 50000 5025000 7943000 1794000 1291000 5821000 9458000 2120000 1700000 5883000 9158000 2038000 1590000 5933000 8711000 1916000 1494000 3853000 3725000 3681000 3245000 06/30/2021 2nd Quarter USD Unaudited 09/30/2021 3rd Quarter USD Unaudited Yes Thousands 16065000 30000 03/31/2021 1st Quarter USD Unaudited Yes Thousands 17141000 09/30/2020 3rd Quarter USD Unaudited Yes Thousands 14531000 Yes Thousands 16229000 s Tesla Inc (NMS: TSLA) 6 7 Exchange rate used is that of the Year End reported date 8 9 10 As Reported Quarterly Balance Sheet 11 Report Date 12 13 Currency 14 Audit Status 15 Consolidated 15 Scale 17 Cash & cash equivalents 18 Short-term marketable securities 19 Restricted cash 20 Accounts receivable, net 21 Raw materials 22 Work in process 23 Finished goods 24 Service parts 26 Inventory 20 Prepaid expenses & other current assets 27 Total current assets 28 Operating lease vehicles, net 29 Solar energy systems in service 30 Initial direct costs related to customer solar energy system lease 31 Solar energy systems, gross 32 Loss: accumulated depreciation & amortization 33 Solar energy systems in service after depreciation & amortizatio 34 Solar energy systems under construction 35 Solar energy systems pending Interconnection 36 Solar energy systems, net 37 Machinery, equipment, vehicles & office furniture 38 Tooling 39 Leasehold Improvements 40 Building & building improvements 41 Land & buildings 1962000 2355000 1061000 1252000 631000 5199000 1746000 25002000 4167000 2129000 2007000 858000 1318000 490000 4733000 1602000 24693000 3748000 1890000 1836000 454000 1341000 501000 413200 1542000 24705000 3390000 1757000 1573000 572000 1674000 399000 4216000 1238000 21744000 2742000 6744000 103000 5847000 897000 5950000 25000 50000 5025000 7943000 1794000 1291000 5821000 9458000 2120000 1700000 5883000 9158000 2038000 1590000 5933000 8711000 1916000 1494000 3853000 3725000 3681000 3245000 1708000 1596000 1494000 1291000 3853000 1284000 5109000 23530000 6232000 17238000 1962000 1260000 269000 201000 3725000 1148000 3626000 21489000 5824000 15665000 1734000 1311000 283000 203000 3681000 1020000 2435000 19257000 5389000 13868000 1647000 1331000 299000 206000 3245000 782000 1607000 16662000 4814000 11848000 1375000 318000 203000 39 Leasehold improvements 40 Building & building improvements 41 Land & buildings 42 Computer equipment, hardware & software 43 Construction in progress 44 Property, plant & equipment, gross 45 Less: accumulated depreciation & amortization 46 Property, plant & equipment, net 47 Operating lease right-of-use assets 4a Digital assets, net 49 Intangible assets, net 50 Goodwill 51 MyPower customer notes receivable, net of current portion 52 Restricted cash, net of current portion 53 Other non-current assets 54 Total assets 55 Accounts payable 56 Accrued purchases 57 Taxes payable 58 Payroll & related costs 59 Accrued warranty reserve, current portion 60 Salos retum reserve, current portion 61 Financing obligation, current portion 62 Operating lease liabilities, current portion 63 Resale value guarantees, current portion 64 Accrued interest 65 Other current liabilities 06 Accrued liabilities & other current liabilities 67 Deferred revenue 68 Resale value guarantees 69 Customer deposits 70 Current portion of debt & finance leases 71 Total current liabilities 72 Recourse debt 73 Non recourse debt 74 Total debt 75 Finance lease 76 Debt & finance leases, not of current portion 1854000 57834000 8260000 1867000 1084000 823000 621000 386000 1626000 55146000 7558000 1437000 834000 840000 608000 382000 1587000 52972000 8648000 993000 828000 660000 544000 430000 1436000 45691000 4958000 711000 635000 502000 400000 461000 48000 251000 20000 51000 173000 3252000 1258000 343000 325000 309000 18000 301000 5443000 1801000 60000 292000 4778000 1693000 30000 273000 4073000 1592000 708000 3120000 13302000 831000 1716000 18051000 2008000 3431000 5430000 999000 6438000 812000 1530000 16371000 3838000 3040000 6878000 993000 7871000 745000 1819000 14877000 4085000 3934000 8019000 1034000 0053000 10550000 34 999000 6438000 1365000 borou 993000 7871000 1318000 10 1034000 9053000 1294000 10559000 1233000 1629000 1115000 325000 40000 1407000 1083000 378000 63000 1330000 990000 424000 144000 1101000 869000 519000 30000 36000 OU 75 Finance lease 76 Debt & finance leases, net of current portion 77 Deferred revenue, net of current portion 78 Resale value guarantees, not of current portion 79 Operating lease liabilities 80 Accrued warranty reserve, net of current portion 81 Sales retum reserve, net of current portion B2 Deferred tax liabilities 83 Financing obligation 84 Resale value guarantees 85 Financing obligation, net of current portion 85 Other noncurrent liabilities 87 Other long-term liabilities 88 Total liabilities 89 Redeemable noncontrolling interests in subsidiaries 90 Convertible senior notes 91 Common stock 32 Additional paid-in capital 93 Accumulated other comprehensive gain (los) 94 Retained earnings (accumulated delicit) 95 Total stockholders' equity (deficit) 06 Noncontrolling interests in subsidiaries 97 377000 3486000 29340000 605000 405000 3336000 28896000 605000 395000 3283000 28507000 601000 1000 28922000 120000 -1990000 27053000 836000 1000 28205000 206000 -3608000 24804000 841000 1000 27623000 143000 4750000 23017000 847000 494000 3049000 28143000 608000 48000 1000 21574000 125000 -5689000 10031000 861000 98 As Reported Quarterly Income Statement 99 Report Date 100 101 Currency 102 Audit Status 103 Consolidated 104 Scale 105 Revenue - automotive sales 105 Revenue - automotive leasing 107 Total automotive revenues 108 Energy generation & storage 109 Services & other revenues 110 Total revenues 111 Cost of revenues automotive sales 112 Cost of revenues - automotive leasing 113 Total automotive cost of revenues 114 Cost of energy generation & Storage 115 Cost of services & other cost of revenues 116 Total cost of revenues 117 Gross profit poss) 118 Research & development expenses 119 Selling, generw & administrative expenses 120 Restructuring & other expenses 121 Total operating expenses 122 Income (055) from operations 123 Interest income 124 Interest expense 125 Other Income (expense), net 126 Income poss) before income taxes 127 Provision (boneft) for income taxes 123 Net Income foss) 129 Net Income (06) attributable to non controlling Interests & rede 130 Net income foss) attributable to common stockholders 131 Net income used in computing net income per share of common 132 Weighted average shares outstanding - basic 133 Weighted average shares outstanding. Gluted 134 Year and shares outstanding 09/30/2021 3rd Quarter USD Unaudited Yes Thousands 11672000 385000 12057000 800000 894000 13757000 8150000 234000 8384000 803000 910000 10097000 3660000 611000 994000 51000 1650000 2004000 10000 126000 6000 1882000 223000 1659000 -41000 1618000 1618000 998000 1123000 1004000 06/30/2021 2nd Quarter USD Unaudited Yes Thousands 9874000 332000 10200000 801000 951000 11958000 7119000 188000 7307000 781000 986000 9074000 2884000 576000 973000 23000 1572000 1312000 11000 75000 45000 1293000 115000 1178000 -36000 1142000 03/31/2021 1st Quarter USD Unaudited Yes Thousands 8705000 297000 9002000 494000 893000 10389000 5457000 180000 6617000 505000 962000 8174000 2215000 866000 1056000 -101000 1621000 594000 10000 99000 28000 533000 89000 464000 26000 438000 09/30/2020 3rd Quarter USD Unaudited Yes Thousands 7346000 265000 7811000 579000 581000 8771000 5361000 145000 5506000 558000 644000 6708000 2063000 366000 888000 1254000 809000 6000 163000 -97000 555000 180000 369000 -38000 331000 971000 1119000 934000 961000 1133000 963000 937000 1105000 948000 131 Net income used in computing net income per share of common 132 Weighted average shares outstanding - basic 133 Weighted average shares outstanding - diluted 134 Year end shares outstanding 135 Net Income (los) per share - basic 136 Net Income foss) per share-diluted 137 1618000 998000 1123000 1004000 1.62 1.44 971000 1119000 984000 1.18 1.02 961000 1133000 963000 046 0.30 937000 1105000 948000 0.32 0.27 09/30/2021 3rd Quarter USD Unaudited Yes Thousands 3301000 2063000 1563000 06/30/2021 2nd Quarter USD Unaudited Yes Thousands 1642000 1302000 1088000 03/31/2021 1st Quarter USD Unaudited Yes Thousands 464000 621000 614000 09/30/2020 3rd Quarter USD Unaudited Yes Thousands 566000 1704000 1101000 144000 140000 128000 88000 48000 8000 213000 27000 - 1000 00000 -78000 2000 8000 -101000 67000 144000 110000 151 As Reported Quarterly Cash Flow 152 Report Date 153 154 Currency 155 Audit Status 156 Consolidated 157 Scale 158 Net Income (los) 159 Depreciation, amortization & Impairment 160 Stock-based compensation 161 Amortization of debt discounts & issuance costs 162 Inventory & purchase commitments write-downs 163 Inventory write downs 164 Loss on disposals of fixed assets 165 Foreign currency transaction net loss (gain) 106 Non-cash interest & other operating activities 107 Digital assets gain, net 183 Operating cash flow related to repayment of discounted convertil 100 Accounts receivable 170 Inventory 171 Operating lease vehicles 172 Prepaid expenses & other current assets 173 Other non-current assets 174 Accounts payable & accrued lilities 175 Deferred revenue 176 Customer deposits 177 Resale value guarantee 178 Other long-term liabilities 179 Net cash flows from operating activities 180 Purchases of property & equipment excluding finance leace, ne 181 Purchases of solar energy systems, net of sales 182 Purchases of digital assets 183 Receipt of government gratis 184 Proceeds from sales of digital assets 165 Purchase of intangible assets A Phase of marketable securities - 148000 - 1175000 1526000 287000 -744000 2764000 452000 B0000 283000 -687000 -916000 -131000 -280000 1592000 279000 52000 - 24000 -106000 426000 -143000 -168000 672000 162000 2000 -580000 -602000 -640000 290000 -105000 785000 118000 - 15000 247000 6912000 4672000 -28000 - 1500000 8000 272000 47000 3765000 2853000 22000 -1500000 6000 272000 23000 1641000 .1348000 - 12000 - 1500000 6000 272000 261000 2924000 -2006000 62000 1000 -5000 -30000 20 -2000 - 15000 247000 6912000 4672000 -28000 - 1500000 6000 272000 47000 3765000 -2853000 -22000 -1500000 6000 272000 23000 1641000 -1348000 - 12000 -1500000 8000 272000 261000 2924000 -2006000 82000 1000 -30000 -5000 -5952000 4097000 -2582000 7633000 -11589000 -9000 4862000 -7400000 8000 2983000 4038000 -8000 -13000 -2065000 7282000 7826000 -7537000 -224000 car guarantee 178 Other long-term liabilities 179 Net cash flows from operating activities 180 Purchases of property & equipment excluding finance leases, ne 181 Purchases of solar energy systems, net of sales 182 Purchases of digital assets 183 Receipt of goverment grants 184 Proceeds from sales of digital assets 185 Purchase of intangible assets 186 Purchase of marketable securities 187 Business combinations, net of cash acquired 188 Net cash flows from investing activities 189 Proceeds from issuances of common stock in public offerings, 190 Proceeds from Issuances of convertible & other debt 191 Repayments of convertible & other debt 192 Collateralized lease repayments 193 Collateralized lease borrowing 194 Collateralized lease borrowings (repayments) 195 Proceeds from exercises of stock options & other stock issuanc 196 Principal payments on finance leases 197 Debt issuance costs 198 Common stock & debt issuance costs 199 Purchase of convertible note hedges 200 Proceeds from issuance of warrants 201 Proceeds from investments by noncontrolling interests in subsid 202 Distributions paid to noncontrolling interests in subsidiaries 203 Payments for buy-outs of noncontrolling interests in subsidiaries 204 Net cash flows from financing activities 205 Effect of exchange rate changes on cash & cash equivalents & 206 Net increase (decrease) in cash & cash equivalents & restricted 207 Cash & cash equivalents & restricted cash, beginning of period 208|Cash & cash equivalents & restricted cash, end of period 209 210 445000 311000 -9000 253000 -196000 -5000 183000 -101000 -5000 361000 248000 6000 2000 -108000 2000 66000 32000 -3946000 -221000 3207000 19901000 16694000 2565000 -179000 -3078000 19901000 16825000 -1010000 221000 -2178000 19901000 17723000 23000 -163000 33000 7281000 100000 8220000 6783000 15003000 In Project Two, you will analyze and evaluate a business's financial health and recommend the best financing options for the business to choose in order to improve its current financial health. Use the Project Two Business Options List PDF to choose the business that you will examine in Project Two. Then, use Mergent Online to locate the most recent quarterly financial statements for the business: the balance sheet, the income statement, and the cash flow statement In order to succeed in your Project Two assignment, you will need to understand the role of financial statements and how they help businesses determine their current financial health. You will also need to describe why cash flow management is important to a business and that business's financial health. Prompt Write a brief journal introducing the business you chose for your Project Two assignment. Specifically, you must address the following rubric criteria: Business Selection: Provide a description of the business you chose, including the business name and what it offers consumers. Financial Statements: Using Mergent Online, provide a copy of the balance sheet, the income statement, and the cash flow statement for your chosen business from the most recent fiscal quarter. Financial Statement Role: Explain why financial statements are important to a business and how they help businesses determine their current financial health. Cash Flow Management: Describe why cash flow management is important to a business and its financial health. Use a recent financial news story as an example to support your claims. . 06/30/2021 2nd Quarter USD Unaudited 09/30/2021 3rd Quarter USD Unaudited Yes Thousands 16065000 30000 03/31/2021 1st Quarter USD Unaudited Yes Thousands 17141000 09/30/2020 3rd Quarter USD Unaudited Yes Thousands 14531000 Yes Thousands 16229000 s Tesla Inc (NMS: TSLA) 6 7 Exchange rate used is that of the Year End reported date 8 9 10 As Reported Quarterly Balance Sheet 11 Report Date 12 13 Currency 14 Audit Status 15 Consolidated 15 Scale 17 Cash & cash equivalents 18 Short-term marketable securities 19 Restricted cash 20 Accounts receivable, net 21 Raw materials 22 Work in process 23 Finished goods 24 Service parts 26 Inventory 20 Prepaid expenses & other current assets 27 Total current assets 28 Operating lease vehicles, net 29 Solar energy systems in service 30 Initial direct costs related to customer solar energy system lease 31 Solar energy systems, gross 32 Loss: accumulated depreciation & amortization 33 Solar energy systems in service after depreciation & amortizatio 34 Solar energy systems under construction 35 Solar energy systems pending Interconnection 36 Solar energy systems, net 37 Machinery, equipment, vehicles & office furniture 38 Tooling 39 Leasehold Improvements 40 Building & building improvements 41 Land & buildings 1962000 2355000 1061000 1252000 631000 5199000 1746000 25002000 4167000 2129000 2007000 858000 1318000 490000 4733000 1602000 24693000 3748000 1890000 1836000 454000 1341000 501000 413200 1542000 24705000 3390000 1757000 1573000 572000 1674000 399000 4216000 1238000 21744000 2742000 6744000 103000 5847000 897000 5950000 25000 50000 5025000 7943000 1794000 1291000 5821000 9458000 2120000 1700000 5883000 9158000 2038000 1590000 5933000 8711000 1916000 1494000 3853000 3725000 3681000 3245000 06/30/2021 2nd Quarter USD Unaudited 09/30/2021 3rd Quarter USD Unaudited Yes Thousands 16065000 30000 03/31/2021 1st Quarter USD Unaudited Yes Thousands 17141000 09/30/2020 3rd Quarter USD Unaudited Yes Thousands 14531000 Yes Thousands 16229000 s Tesla Inc (NMS: TSLA) 6 7 Exchange rate used is that of the Year End reported date 8 9 10 As Reported Quarterly Balance Sheet 11 Report Date 12 13 Currency 14 Audit Status 15 Consolidated 15 Scale 17 Cash & cash equivalents 18 Short-term marketable securities 19 Restricted cash 20 Accounts receivable, net 21 Raw materials 22 Work in process 23 Finished goods 24 Service parts 26 Inventory 20 Prepaid expenses & other current assets 27 Total current assets 28 Operating lease vehicles, net 29 Solar energy systems in service 30 Initial direct costs related to customer solar energy system lease 31 Solar energy systems, gross 32 Loss: accumulated depreciation & amortization 33 Solar energy systems in service after depreciation & amortizatio 34 Solar energy systems under construction 35 Solar energy systems pending Interconnection 36 Solar energy systems, net 37 Machinery, equipment, vehicles & office furniture 38 Tooling 39 Leasehold Improvements 40 Building & building improvements 41 Land & buildings 1962000 2355000 1061000 1252000 631000 5199000 1746000 25002000 4167000 2129000 2007000 858000 1318000 490000 4733000 1602000 24693000 3748000 1890000 1836000 454000 1341000 501000 413200 1542000 24705000 3390000 1757000 1573000 572000 1674000 399000 4216000 1238000 21744000 2742000 6744000 103000 5847000 897000 5950000 25000 50000 5025000 7943000 1794000 1291000 5821000 9458000 2120000 1700000 5883000 9158000 2038000 1590000 5933000 8711000 1916000 1494000 3853000 3725000 3681000 3245000 1708000 1596000 1494000 1291000 3853000 1284000 5109000 23530000 6232000 17238000 1962000 1260000 269000 201000 3725000 1148000 3626000 21489000 5824000 15665000 1734000 1311000 283000 203000 3681000 1020000 2435000 19257000 5389000 13868000 1647000 1331000 299000 206000 3245000 782000 1607000 16662000 4814000 11848000 1375000 318000 203000 39 Leasehold improvements 40 Building & building improvements 41 Land & buildings 42 Computer equipment, hardware & software 43 Construction in progress 44 Property, plant & equipment, gross 45 Less: accumulated depreciation & amortization 46 Property, plant & equipment, net 47 Operating lease right-of-use assets 4a Digital assets, net 49 Intangible assets, net 50 Goodwill 51 MyPower customer notes receivable, net of current portion 52 Restricted cash, net of current portion 53 Other non-current assets 54 Total assets 55 Accounts payable 56 Accrued purchases 57 Taxes payable 58 Payroll & related costs 59 Accrued warranty reserve, current portion 60 Salos retum reserve, current portion 61 Financing obligation, current portion 62 Operating lease liabilities, current portion 63 Resale value guarantees, current portion 64 Accrued interest 65 Other current liabilities 06 Accrued liabilities & other current liabilities 67 Deferred revenue 68 Resale value guarantees 69 Customer deposits 70 Current portion of debt & finance leases 71 Total current liabilities 72 Recourse debt 73 Non recourse debt 74 Total debt 75 Finance lease 76 Debt & finance leases, not of current portion 1854000 57834000 8260000 1867000 1084000 823000 621000 386000 1626000 55146000 7558000 1437000 834000 840000 608000 382000 1587000 52972000 8648000 993000 828000 660000 544000 430000 1436000 45691000 4958000 711000 635000 502000 400000 461000 48000 251000 20000 51000 173000 3252000 1258000 343000 325000 309000 18000 301000 5443000 1801000 60000 292000 4778000 1693000 30000 273000 4073000 1592000 708000 3120000 13302000 831000 1716000 18051000 2008000 3431000 5430000 999000 6438000 812000 1530000 16371000 3838000 3040000 6878000 993000 7871000 745000 1819000 14877000 4085000 3934000 8019000 1034000 0053000 10550000 34 999000 6438000 1365000 borou 993000 7871000 1318000 10 1034000 9053000 1294000 10559000 1233000 1629000 1115000 325000 40000 1407000 1083000 378000 63000 1330000 990000 424000 144000 1101000 869000 519000 30000 36000 OU 75 Finance lease 76 Debt & finance leases, net of current portion 77 Deferred revenue, net of current portion 78 Resale value guarantees, not of current portion 79 Operating lease liabilities 80 Accrued warranty reserve, net of current portion 81 Sales retum reserve, net of current portion B2 Deferred tax liabilities 83 Financing obligation 84 Resale value guarantees 85 Financing obligation, net of current portion 85 Other noncurrent liabilities 87 Other long-term liabilities 88 Total liabilities 89 Redeemable noncontrolling interests in subsidiaries 90 Convertible senior notes 91 Common stock 32 Additional paid-in capital 93 Accumulated other comprehensive gain (los) 94 Retained earnings (accumulated delicit) 95 Total stockholders' equity (deficit) 06 Noncontrolling interests in subsidiaries 97 377000 3486000 29340000 605000 405000 3336000 28896000 605000 395000 3283000 28507000 601000 1000 28922000 120000 -1990000 27053000 836000 1000 28205000 206000 -3608000 24804000 841000 1000 27623000 143000 4750000 23017000 847000 494000 3049000 28143000 608000 48000 1000 21574000 125000 -5689000 10031000 861000 98 As Reported Quarterly Income Statement 99 Report Date 100 101 Currency 102 Audit Status 103 Consolidated 104 Scale 105 Revenue - automotive sales 105 Revenue - automotive leasing 107 Total automotive revenues 108 Energy generation & storage 109 Services & other revenues 110 Total revenues 111 Cost of revenues automotive sales 112 Cost of revenues - automotive leasing 113 Total automotive cost of revenues 114 Cost of energy generation & Storage 115 Cost of services & other cost of revenues 116 Total cost of revenues 117 Gross profit poss) 118 Research & development expenses 119 Selling, generw & administrative expenses 120 Restructuring & other expenses 121 Total operating expenses 122 Income (055) from operations 123 Interest income 124 Interest expense 125 Other Income (expense), net 126 Income poss) before income taxes 127 Provision (boneft) for income taxes 123 Net Income foss) 129 Net Income (06) attributable to non controlling Interests & rede 130 Net income foss) attributable to common stockholders 131 Net income used in computing net income per share of common 132 Weighted average shares outstanding - basic 133 Weighted average shares outstanding. Gluted 134 Year and shares outstanding 09/30/2021 3rd Quarter USD Unaudited Yes Thousands 11672000 385000 12057000 800000 894000 13757000 8150000 234000 8384000 803000 910000 10097000 3660000 611000 994000 51000 1650000 2004000 10000 126000 6000 1882000 223000 1659000 -41000 1618000 1618000 998000 1123000 1004000 06/30/2021 2nd Quarter USD Unaudited Yes Thousands 9874000 332000 10200000 801000 951000 11958000 7119000 188000 7307000 781000 986000 9074000 2884000 576000 973000 23000 1572000 1312000 11000 75000 45000 1293000 115000 1178000 -36000 1142000 03/31/2021 1st Quarter USD Unaudited Yes Thousands 8705000 297000 9002000 494000 893000 10389000 5457000 180000 6617000 505000 962000 8174000 2215000 866000 1056000 -101000 1621000 594000 10000 99000 28000 533000 89000 464000 26000 438000 09/30/2020 3rd Quarter USD Unaudited Yes Thousands 7346000 265000 7811000 579000 581000 8771000 5361000 145000 5506000 558000 644000 6708000 2063000 366000 888000 1254000 809000 6000 163000 -97000 555000 180000 369000 -38000 331000 971000 1119000 934000 961000 1133000 963000 937000 1105000 948000 131 Net income used in computing net income per share of common 132 Weighted average shares outstanding - basic 133 Weighted average shares outstanding - diluted 134 Year end shares outstanding 135 Net Income (los) per share - basic 136 Net Income foss) per share-diluted 137 1618000 998000 1123000 1004000 1.62 1.44 971000 1119000 984000 1.18 1.02 961000 1133000 963000 046 0.30 937000 1105000 948000 0.32 0.27 09/30/2021 3rd Quarter USD Unaudited Yes Thousands 3301000 2063000 1563000 06/30/2021 2nd Quarter USD Unaudited Yes Thousands 1642000 1302000 1088000 03/31/2021 1st Quarter USD Unaudited Yes Thousands 464000 621000 614000 09/30/2020 3rd Quarter USD Unaudited Yes Thousands 566000 1704000 1101000 144000 140000 128000 88000 48000 8000 213000 27000 - 1000 00000 -78000 2000 8000 -101000 67000 144000 110000 151 As Reported Quarterly Cash Flow 152 Report Date 153 154 Currency 155 Audit Status 156 Consolidated 157 Scale 158 Net Income (los) 159 Depreciation, amortization & Impairment 160 Stock-based compensation 161 Amortization of debt discounts & issuance costs 162 Inventory & purchase commitments write-downs 163 Inventory write downs 164 Loss on disposals of fixed assets 165 Foreign currency transaction net loss (gain) 106 Non-cash interest & other operating activities 107 Digital assets gain, net 183 Operating cash flow related to repayment of discounted convertil 100 Accounts receivable 170 Inventory 171 Operating lease vehicles 172 Prepaid expenses & other current assets 173 Other non-current assets 174 Accounts payable & accrued lilities 175 Deferred revenue 176 Customer deposits 177 Resale value guarantee 178 Other long-term liabilities 179 Net cash flows from operating activities 180 Purchases of property & equipment excluding finance leace, ne 181 Purchases of solar energy systems, net of sales 182 Purchases of digital assets 183 Receipt of government gratis 184 Proceeds from sales of digital assets 165 Purchase of intangible assets A Phase of marketable securities - 148000 - 1175000 1526000 287000 -744000 2764000 452000 B0000 283000 -687000 -916000 -131000 -280000 1592000 279000 52000 - 24000 -106000 426000 -143000 -168000 672000 162000 2000 -580000 -602000 -640000 290000 -105000 785000 118000 - 15000 247000 6912000 4672000 -28000 - 1500000 8000 272000 47000 3765000 2853000 22000 -1500000 6000 272000 23000 1641000 .1348000 - 12000 - 1500000 6000 272000 261000 2924000 -2006000 62000 1000 -5000 -30000 20 -2000 - 15000 247000 6912000 4672000 -28000 - 1500000 6000 272000 47000 3765000 -2853000 -22000 -1500000 6000 272000 23000 1641000 -1348000 - 12000 -1500000 8000 272000 261000 2924000 -2006000 82000 1000 -30000 -5000 -5952000 4097000 -2582000 7633000 -11589000 -9000 4862000 -7400000 8000 2983000 4038000 -8000 -13000 -2065000 7282000 7826000 -7537000 -224000 car guarantee 178 Other long-term liabilities 179 Net cash flows from operating activities 180 Purchases of property & equipment excluding finance leases, ne 181 Purchases of solar energy systems, net of sales 182 Purchases of digital assets 183 Receipt of goverment grants 184 Proceeds from sales of digital assets 185 Purchase of intangible assets 186 Purchase of marketable securities 187 Business combinations, net of cash acquired 188 Net cash flows from investing activities 189 Proceeds from issuances of common stock in public offerings, 190 Proceeds from Issuances of convertible & other debt 191 Repayments of convertible & other debt 192 Collateralized lease repayments 193 Collateralized lease borrowing 194 Collateralized lease borrowings (repayments) 195 Proceeds from exercises of stock options & other stock issuanc 196 Principal payments on finance leases 197 Debt issuance costs 198 Common stock & debt issuance costs 199 Purchase of convertible note hedges 200 Proceeds from issuance of warrants 201 Proceeds from investments by noncontrolling interests in subsid 202 Distributions paid to noncontrolling interests in subsidiaries 203 Payments for buy-outs of noncontrolling interests in subsidiaries 204 Net cash flows from financing activities 205 Effect of exchange rate changes on cash & cash equivalents & 206 Net increase (decrease) in cash & cash equivalents & restricted 207 Cash & cash equivalents & restricted cash, beginning of period 208|Cash & cash equivalents & restricted cash, end of period 209 210 445000 311000 -9000 253000 -196000 -5000 183000 -101000 -5000 361000 248000 6000 2000 -108000 2000 66000 32000 -3946000 -221000 3207000 19901000 16694000 2565000 -179000 -3078000 19901000 16825000 -1010000 221000 -2178000 19901000 17723000 23000 -163000 33000 7281000 100000 8220000 6783000 15003000
Step by Step Solution
There are 3 Steps involved in it

Get step-by-step solutions from verified subject matter experts