Question: Could someone please help me with this assignment using Jupyter Notebook? This is an exercise on Bokeh. Instructions 1. In this assignment, you are given
Could someone please help me with this assignment using Jupyter Notebook?
This is an exercise on Bokeh.
Instructions 1. In this assignment, you are given the county-level 2016 presidential election data. Each row in the table is a county with the percentage of voting to democratic or republican.
2. Download your data here to work with:
***Please note the "election.zip" file includes a dbf file NOT a csv file***
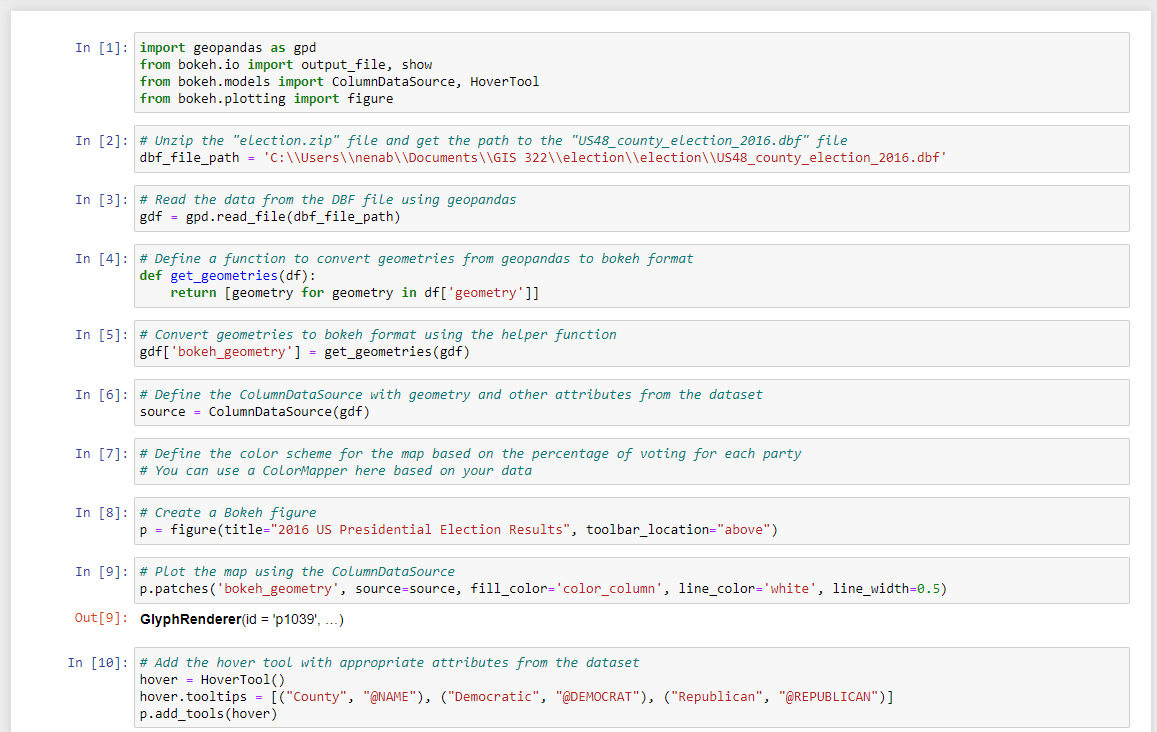
3. Invent an interactive map of the 2016 US Presidential election results using Bokeh library. When you hover the mouse over a county, it should show the name of the county and the percentage of voting for each party.
[**] Adapt the helper function from module 6 to convert geometries from geopandas to bokeh format 2pts
Module 6:
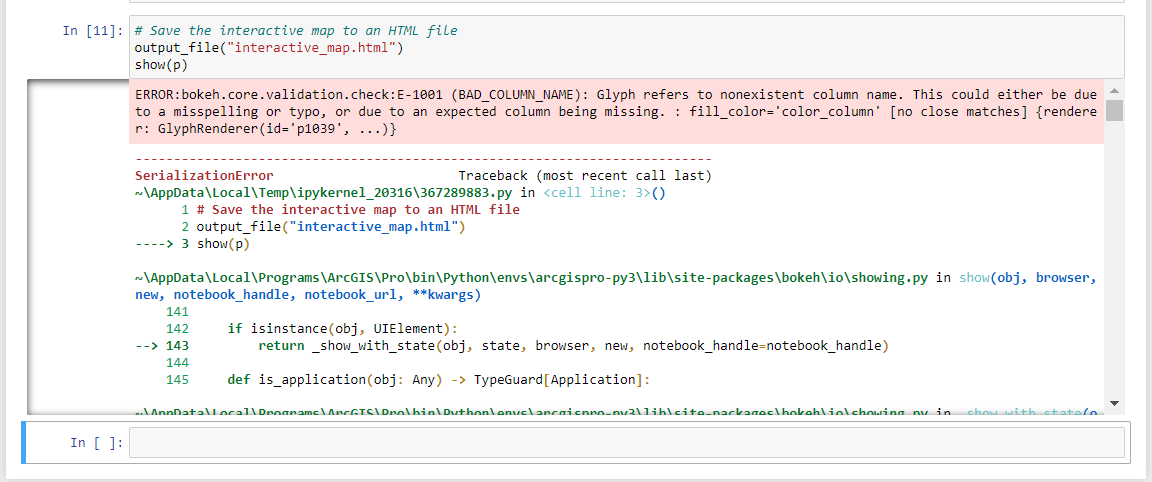
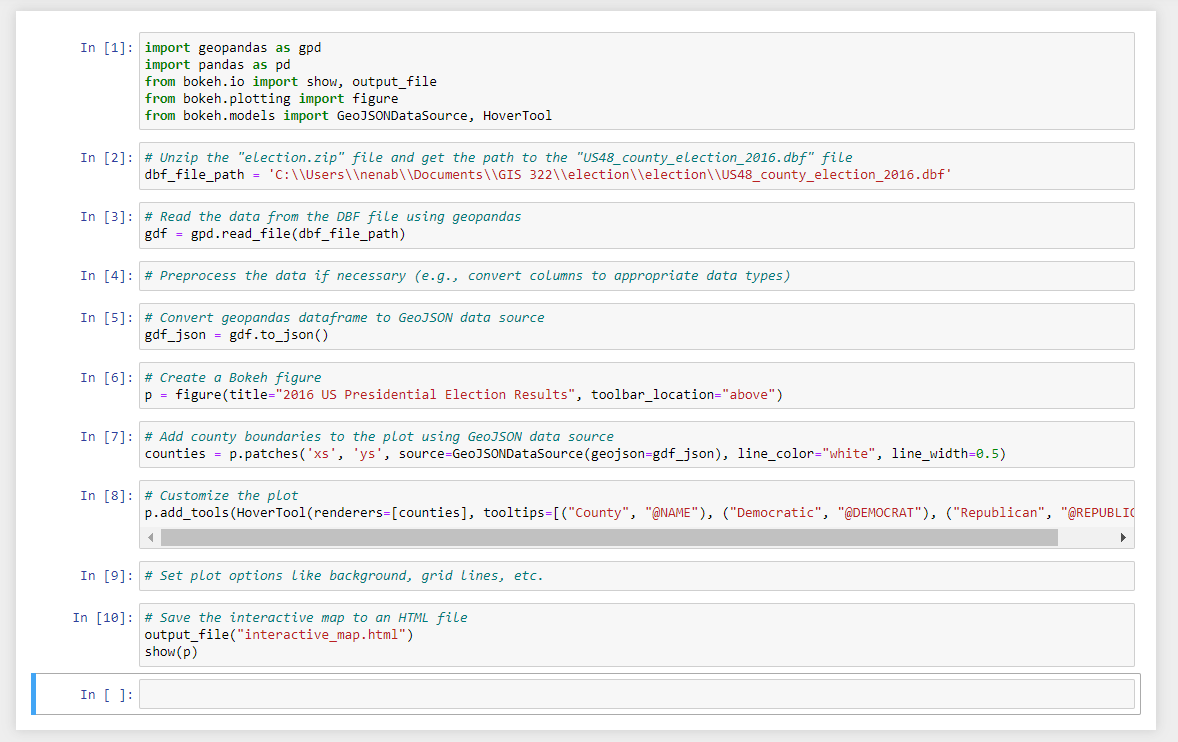
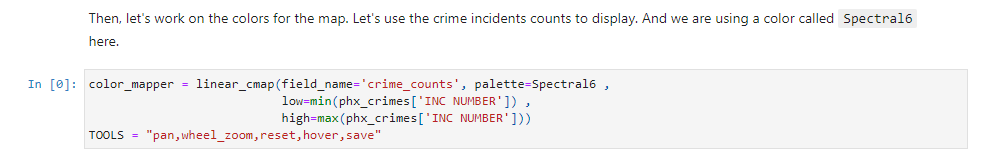
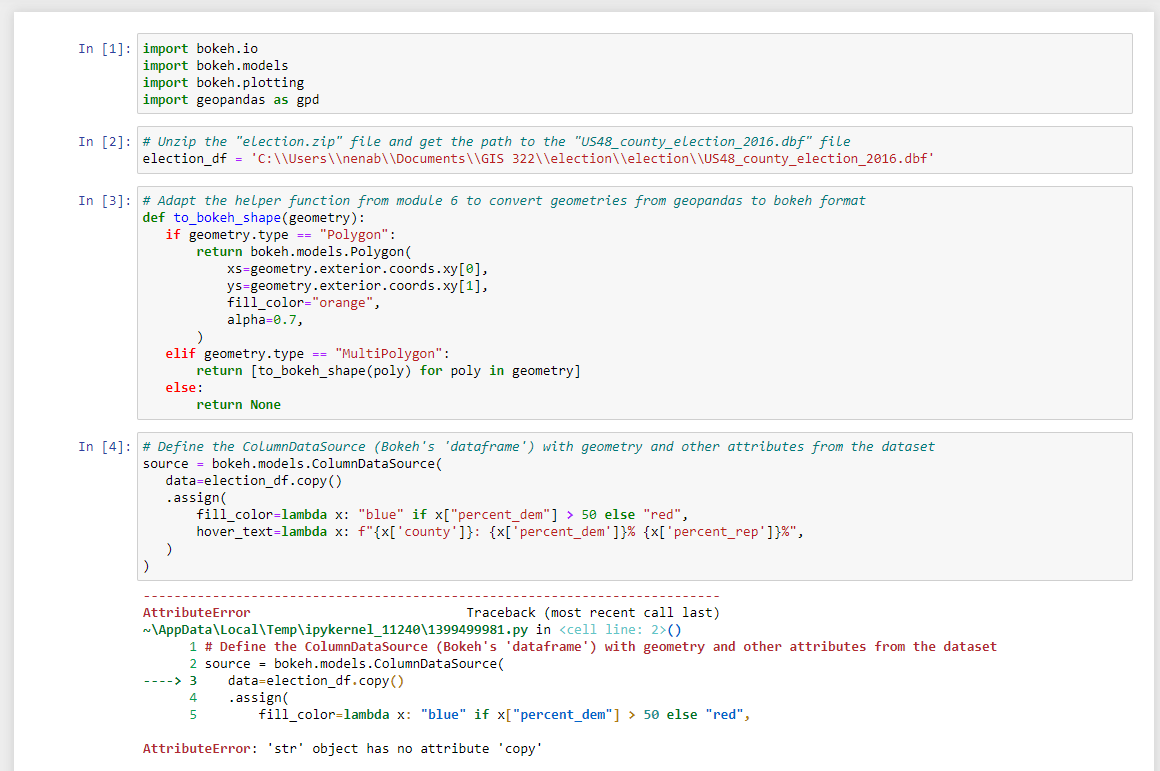
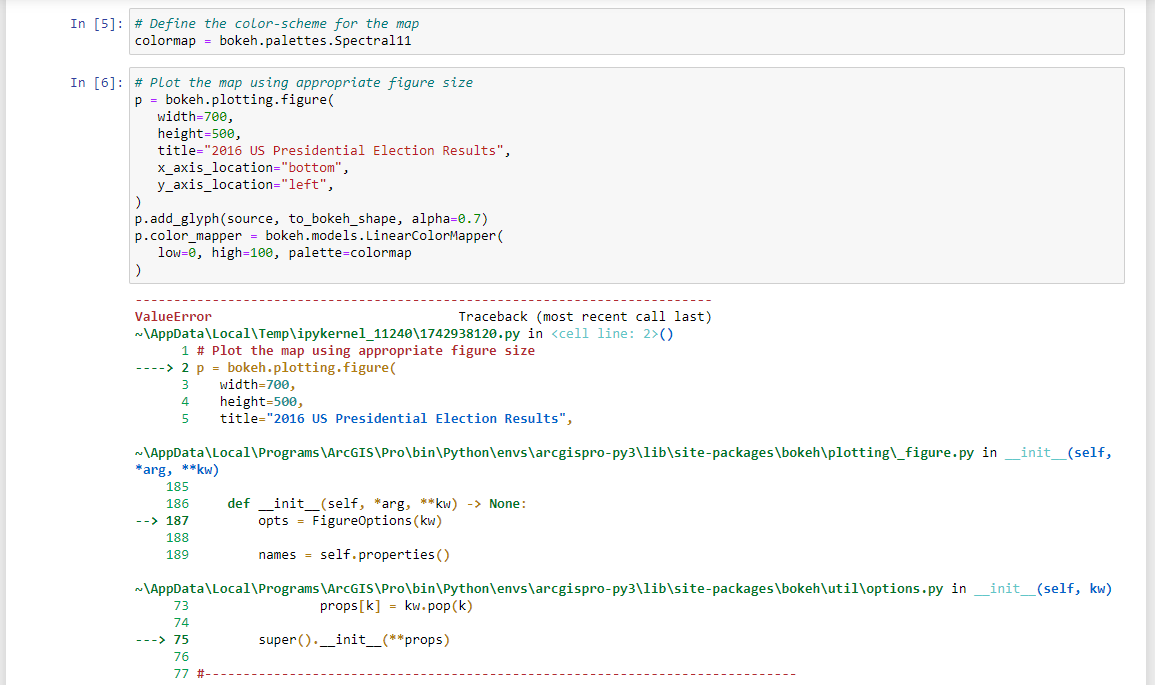
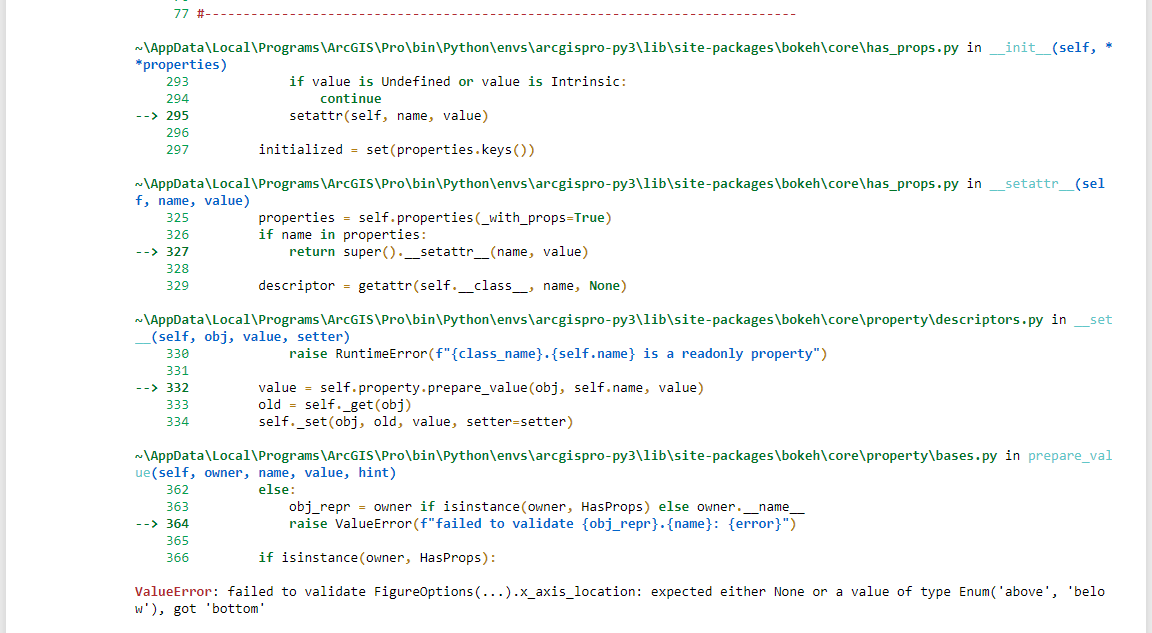
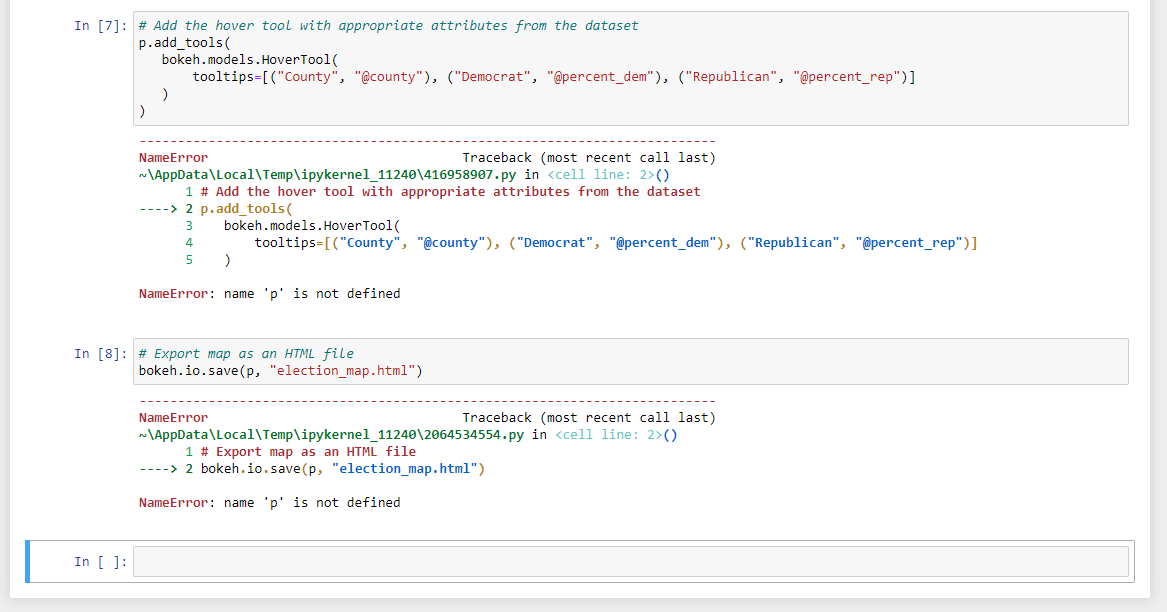
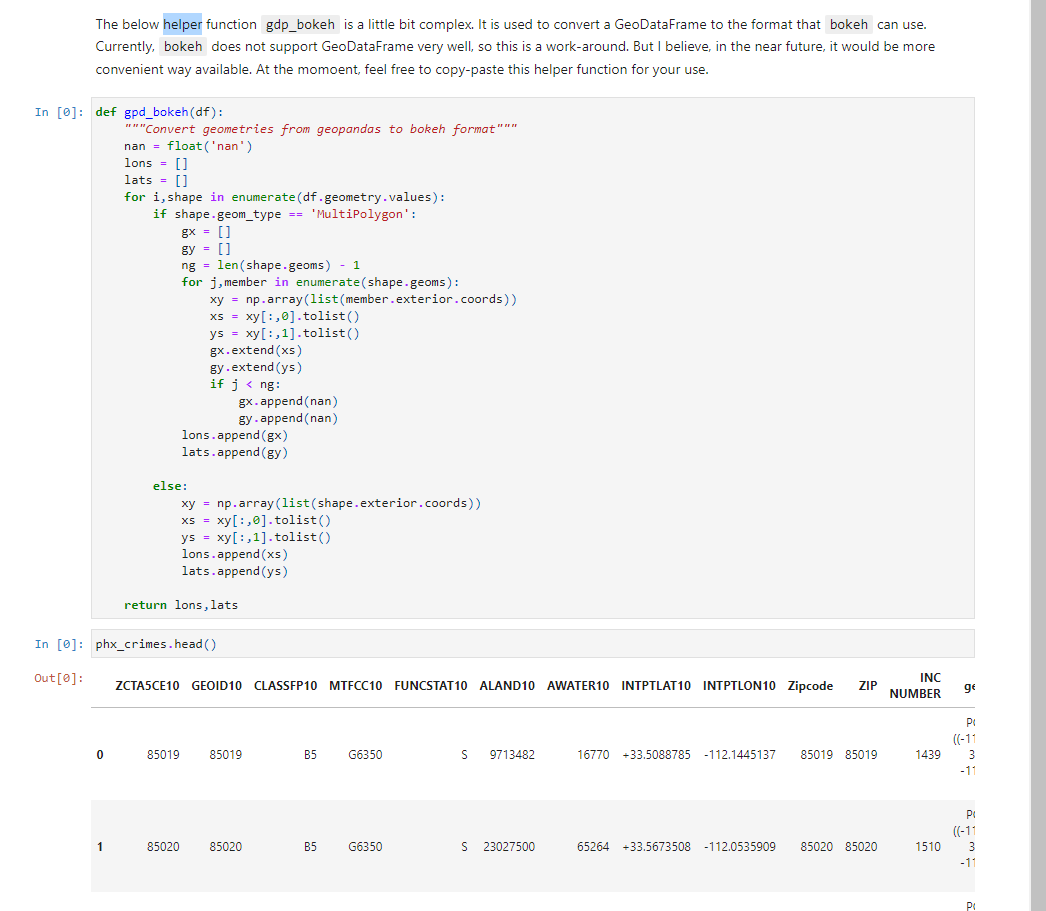
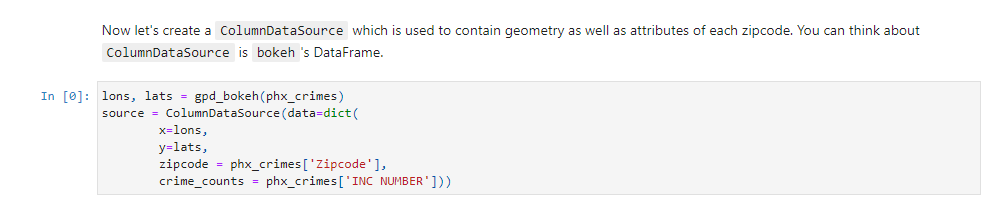
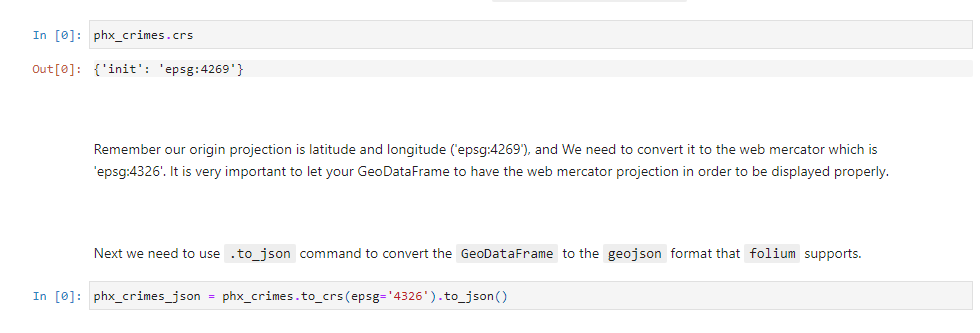
Then, let's work on the colors for the map. Let's use the crime incidents counts to display. And we are using a color called Spectral6 here. In [0]: color_mapper = linear_cmap(field_name='crime_counts', palette=Spectral6 , low=min(phx_crimes [' INC NUMBER' ]) , high=max(phx_crimes [ ' INC NUMBER' ]) ) TOOLS = "pan, wheel_zoom, reset, hover, save"In [1] : import bokeh. io import bokeh . models import bokeh. plotting import geopandas as god In [2]: # Unzip the "election. zip" file and get the path to the "US48_county_election_2016. dbf" file election_df = 'c:\\\\Users\\\ enab\\\\Documents\\\\GIS 322\\\\election\\\\election\\\\U548_county_election_2016.dbf* In [3]: # Adapt the helper function from module 6 to convert geometries from geopandas to bokeh format def to_bokeh_shape (geometry ) : if geometry . type == "Polygon": return bokeh. models. Polygon( x5=geometry . exterior . coords . xy[0], ys=geometry . exterior . coords. xy[1], fill_color="orange", alpha=0.7, elif geometry . type == "MultiPolygon": return [to_bokeh_shape (poly) for poly in geometry] else : return None In [4]: # Define the ColumnDataSource (Bokeh's 'dataframe' ) with geometry and other attributes from the dataset source = bokeh . models . ColumnDataSource( data=election_df . copy () . assign( fill_color=lambda x: "blue" if x["percent_dem"] > 50 else "red", hover_text=lambda x: f"{x['county']}: {x['percent_dem' ]}% {x['percent_rep' ]]%", AttributeError Traceback (most recent call last) "\\AppData\\Local\\Temp\\ipykernel_11240\\1399499981. py in () 1 # Define the ColumnDataSource (Bokeh's 'dataframe' ) with geometry and other attributes from the dataset 2 source = bokeh. models . ColumnDataSource( - - --> 3 data=election_df . copy() 4 . assign( fill_color=lambda x: "blue" if x["percent_dem"] > 50 else "red", AttributeError: 'str object has no attribute 'copyIn [5]: # Define the color-scheme for the map colormap = bokeh . palettes . Spectral11 In [6]: # Plot the map using appropriate figure size p = bokeh . plotting . figure( width=700, height=500, title="2016 US Presidential Election Results", x_axis_location="bottom", y_axis_location="left", p. add_glyph(source, to_bokeh_shape, alpha=0. 7) p. color_mapper = bokeh. models . LinearColorMapper( low=0, high=100, palette=colormap ValueError Traceback (most recent call last) "\\AppData\\Local\\Temp\\ipykernel_11240\\1742938120. py in () 1 # Plot the map using appropriate figure size - ---> 2 p = bokeh . plotting . figure( width=700, height=500, 5 title="2016 US Presidential Election Results", "\\AppData\\Local\\Programs \\ArcGIS\\Pro\\bin\\Python\\envs\\arcgispro-py3\\lib\\site-packages\\bokeh\\plotting\\_figure. py in _init_(self, *arg, **kw) 185 186 def _init_(self, *arg, *#kw) -> None: 187 opts = FigureOptions (kw) 188 189 names = self . properties() ~\\AppData\\Local\\Programs \\ArcGIS\\Pro\\bin\\Python\\envs\\arcgispro-py3\\lib\\site-packages\\bokeh\\util\\options . py in _init_(self, kw) 73 props [k] = kw. pop (k) 74 - --> 75 super () .__init_(**props) 76 77 #-77 #- "\\AppData\\Local\\Programs \\ArcGIS\\Pro\\bin\\Python\\envs\\arcgispro-py3\\lib\\site-packages\\bokeh\\core\\has_props. py in _init_(self, * *properties) 293 if value is Undefined or value is Intrinsic: 294 continue - -> 295 setattr (self, name, value) 296 297 initialized = set(properties . keys() ) "\\AppData\\Local\\Programs\\ArcGIS\\Pro\\bin\\Python\\envs\\arcgispro-py3\\lib\\site-packages\\bokeh\\core\\has_props . py in _setattr_(sel f, name, value) 325 properties = self . properties(_with_props=True) 326 if name in properties: 327 return super() .__setattr__(name, value) 328 329 descriptor = getattr (self._class_, name, None) "\\AppData\\Local\\Programs\\ArcGIS\\Pro\\bin\\Python\\envs\\arcgispro-py3\\lib\\site-packages\\bokeh\\core\\property\\descriptors . py in set (self, obj, value, setter) 330 raise RuntimeError (f" {class_name). {self . name} is a readonly property") 331 - -> 332 value = self . property . prepare_value(obj, self . name, value) 333 old = self._get(obj) 334 self._set(obj, old, value, setter=setter) "\\AppData\\Local\\Programs \\ArcGIS\\Pro\\bin\\Python\\envs\\arcgispro-py3\\lib\\site-packages\\bokeh\\core\\property\\bases . py in prepare_val ue(self, owner, name, value, hint) 362 else: 363 obj_repr = owner if isinstance(owner, HasProps) else owner. _name_ - -> 364 raise ValueError (f" failed to validate {obj_repr} . {name}: {error}") 365 366 if isinstance(owner, HasProps) : ValueError: failed to validate FigureOptions(. ..).x_axis_location: expected either None or a value of type Enum('above', 'belo w' ), got 'bottom'In [7]: # Add the hover tool with appropriate attributes from the dataset p. add_tools( bokeh . models . HoverTool( tooltips=[("County", "@county"), ("Democrat", "@percent_dem"), ("Republican", "@percent_rep") ] Name Error Traceback (most recent call last) w\\AppData\\Local\\Temp\\ipykernel_11240\\416958907. py in () 1 # Add the hover tool with appropriate attributes from the dataset - ---> 2 p. add_tools( WU bokeh . models . HoverTool( tooltips=[("County", "@county"), ("Democrat", "@percent_dem"), ("Republican", "@percent_rep") ] NameError: name 'p' is not defined In [8]: # Export map as an HTML file bokeh. io. save(p, "election_map. html") NameError Traceback (most recent call last) ~\\AppData\\Local\\Temp\\ipykernel_11240\\2064534554. py in () 1 # Export map as an HTML file - ---> 2 bokeh . io. save(p, "election_map. html") NameError: name 'p' is not defined In [ ]:The below helper function gap_bokeh is a little bit complex. It is used to convert a GeoDataFrame to the format that bokeh can use. Currently, bokeh does not support GeoDataFrame very well, so this is a work-around. But I believe, in the near future, it would be more convenient way available. At the momoent, feel free to copy-paste this helper function for your use. In [0]: def gpd_bokeh(df) : """Convert geometries from geopandas to bokeh format"" nan = float ('nan" ) lons = lats = for i, shape in enumerate (df . geometry . values) : if shape.geom_type == 'MultiPolygon' : gx = By = ng = len (shape . geoms) - 1 for j, member in enumerate(shape . geoms) : xy = np. array(list(member . exterior . coords) ) x5 = xy[ : , 0] . tolist( ) ys = xy[ : , 1] . tolist( ) gx. extend (x5 ) By - extend (ys ) if j () 1 # Save the interactive map to an HTML file 2 output_file("interactive_map. html") -> 3 show(p) ~\\AppData\\Local\\Programs \\ArcGIS\\Pro\\bin\\Python\\envs\\arcgispro-py3\\lib\\site-packages\\bokeh\\io\\showing . py in show(obj, browser, new, notebook_handle, notebook_url, **kwargs) 141 142 if isinstance(obj, UIElement) : - -> 143 return _show_with_state(obj, state, browser, new, notebook_handle=notebook_handle) 144 145 def is_application(obj: Any) -> TypeGuard[Application] : chow with chatofn In [ ]:In [1]: import geopandas as god import pandas as pd from bokeh. io import show, output_file from bokeh. plotting import figure from bokeh. models import GeoJSONDataSource, HoverTool In [2]: # Unzip the "election. zip" file and get the path to the "US48_county_election_2016. dbf" file dbf_file_path = 'c:\\\\Users\\\\menab\\\\Documents\\\\GIS 322\\\\election\\\\election\\\\US48_county_election_2016. dbf* In [3]: # Read the data from the DBF file using geopandas gdf = gpd . read_file(dbf_file_path) In [4]: # Preprocess the data if necessary (e.g., convert columns to appropriate data types) In [5]: # Convert geopandas dataframe to GeoJSON data source gdf_json = gdf. to_json() In [6]: # Create a Bokeh figure p = figure(title="2016 US Presidential Election Results", toolbar_location="above") In [7] : # Add county boundaries to the plot using GeoJSON data source counties = p. patches('xs', 'ys', source=GeoJSONDataSource (geojson=gdf-json), line_color="white", line_width=0.5) In [8]: # Customize the plot p. add_tools (HoverTool(renderers=[counties], tooltips=[("County", "@NAME"), ("Democratic", "@DEMOCRAT"), ("Republican", "@REPUBLIC In [9]: # Set plot options Like background, grid Lines, etc. In [10]: # Save the interactive map to an HTML file output_file("interactive_map. html") show (P) In [ ]
Step by Step Solution
There are 3 Steps involved in it
1 Expert Approved Answer
Step: 1 Unlock
Question Has Been Solved by an Expert!
Get step-by-step solutions from verified subject matter experts
Step: 2 Unlock
Step: 3 Unlock
Students Have Also Explored These Related Programming Questions!


![the percentage of voting for each party.Guidehttps:/bviewer.org/github/mehak-sachdeva/ASU-GIS-322-Fall-19/blob/masterotebooks/6_1_Making_interactive_maps_using_bokeh.ipynbGrading[**] Read the election dataset 1pt[**]](https://dsd5zvtm8ll6.cloudfront.net/si.experts.images/questions/2024/09/66f83c9fd79c0_47966f83c9fb68bb.jpg)