

Question: Could someone please help me with this?! its an emergency !!! Cost of goods sold Cash Depreciation Interest expense Selling & Administrative Accounts payable Fixed
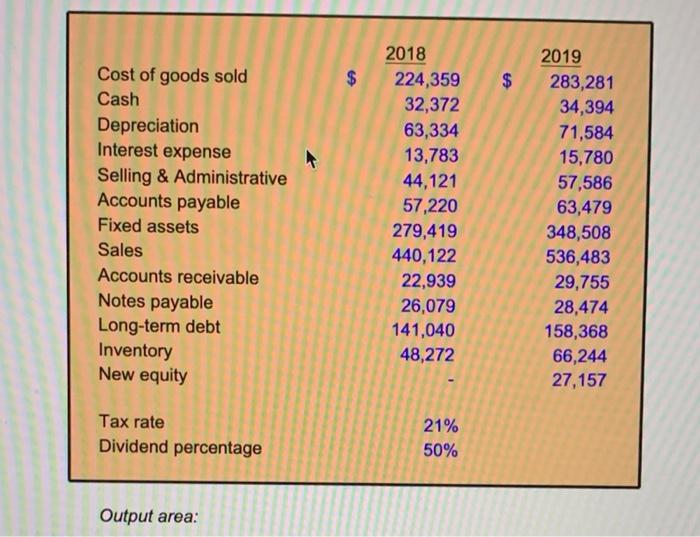
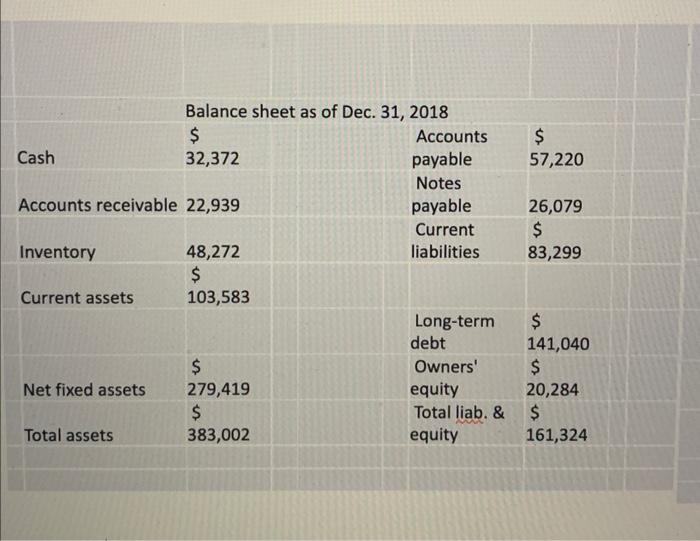
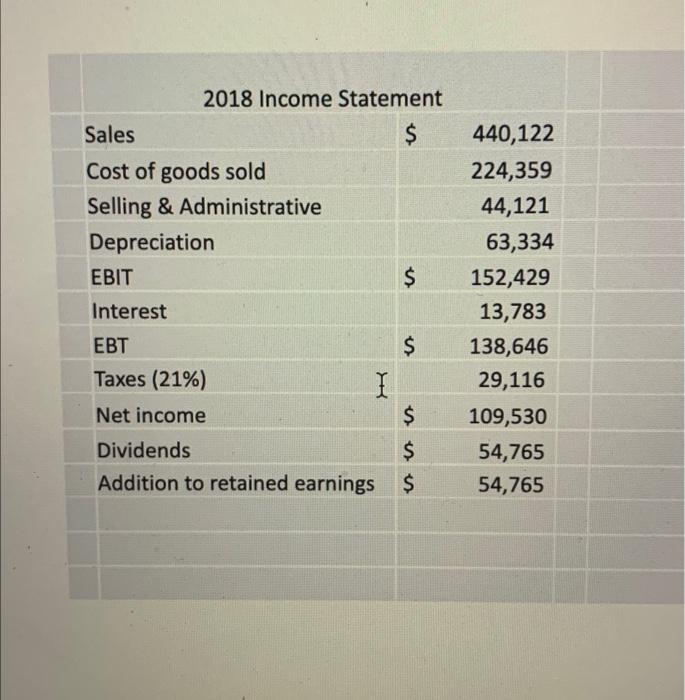
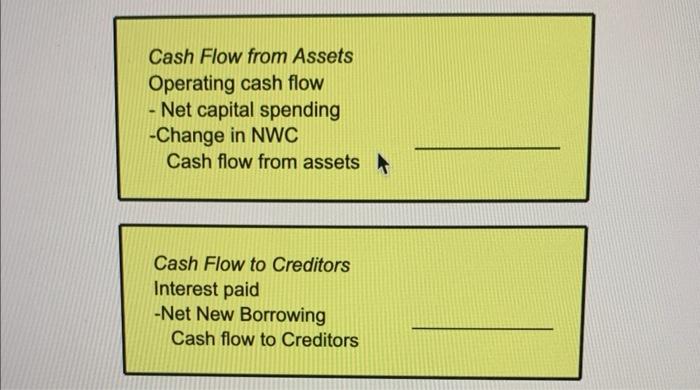
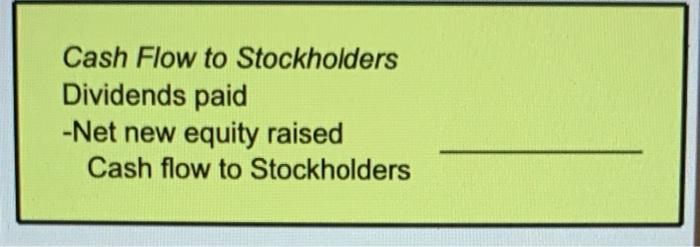
Cost of goods sold Cash Depreciation Interest expense Selling & Administrative Accounts payable Fixed assets Sales Accounts receivable Notes payable Long-term debt Inventory New equity Tax rate Dividend percentage Output area: 4 $ 2018 224,359 32,372 63,334 13,783 44,121 57,220 279,419 440,122 22,939 26,079 141,040 48,272 21% 50% $ 2019 283,281 34,394 71,584 15,780 57,586 63,479 348,508 536,483 29,755 28,474 158,368 66,244 27,157 Cash Accounts receivable 22,939 Inventory Current assets Net fixed assets Balance sheet as of Dec. 31, 2018 $ 32,372 Total assets 48,272 $ 103,583 $ 279,419 $ 383,002 Accounts payable Notes payable Current liabilities Long-term debt Owners' equity Total liab. & equity $ 57,220 26,079 $ 83,299 $ 141,040 $ 20,284 $ 161,324 2018 Income Statement $ Sales Cost of goods sold Selling & Administrative Depreciation EBIT Interest EBT Taxes (21%) Net income I $ $ es esse $ Dividends Addition to retained earnings $ $ 440,122 224,359 44,121 63,334 152,429 13,783 138,646 29,116 109,530 54,765 54,765 Cash Flow from Assets Operating cash flow Net capital spending -Change in NWC Cash flow from assets Cash Flow to Creditors Interest paid -Net New Borrowing Cash flow to Creditors Cash Flow to Stockholders Dividends paid -Net new equity raised Cash flow to Stockholders Cost of goods sold Cash Depreciation Interest expense Selling & Administrative Accounts payable Fixed assets Sales Accounts receivable Notes payable Long-term debt Inventory New equity Tax rate Dividend percentage Output area: 4 $ 2018 224,359 32,372 63,334 13,783 44,121 57,220 279,419 440,122 22,939 26,079 141,040 48,272 21% 50% $ 2019 283,281 34,394 71,584 15,780 57,586 63,479 348,508 536,483 29,755 28,474 158,368 66,244 27,157 Cash Accounts receivable 22,939 Inventory Current assets Net fixed assets Balance sheet as of Dec. 31, 2018 $ 32,372 Total assets 48,272 $ 103,583 $ 279,419 $ 383,002 Accounts payable Notes payable Current liabilities Long-term debt Owners' equity Total liab. & equity $ 57,220 26,079 $ 83,299 $ 141,040 $ 20,284 $ 161,324 2018 Income Statement $ Sales Cost of goods sold Selling & Administrative Depreciation EBIT Interest EBT Taxes (21%) Net income I $ $ es esse $ Dividends Addition to retained earnings $ $ 440,122 224,359 44,121 63,334 152,429 13,783 138,646 29,116 109,530 54,765 54,765 Cash Flow from Assets Operating cash flow Net capital spending -Change in NWC Cash flow from assets Cash Flow to Creditors Interest paid -Net New Borrowing Cash flow to Creditors Cash Flow to Stockholders Dividends paid -Net new equity raised Cash flow to Stockholders
Step by Step Solution
There are 3 Steps involved in it

Get step-by-step solutions from verified subject matter experts