

Question: Could someone please help with this assignment Risk and Return Analysis Mr. Tom Silverman invests in stocks, bonds, mutual funds, and other financial assets. Tom
Could someone please help with this assignment
Risk and Return Analysis
Mr. Tom Silverman invests in stocks, bonds, mutual funds, and other financial assets. Tom knows that investing in stocks is risky and he has about $3MM dollars to invest. He would like to play it safe, so he plans to invest $1MM in U.S. Treasury Bonds with 10-year maturity. He plans to invest the remaining $2MM in the stocks of 2 companies, Cinplat Inc. and Solvay Inc.
Cinplat Inc. is a software company, which has been in business for more than 10 years. Solvay Inc. is a distributor that has been in business for nearly 20 years. Solvay Inc. has distribution centers, warehouses, and trucking companies in the U.S. Tom believes that if he invests in stocks of companies in 2 different industries, he can reduce his risk.
The financial situation in the U.S. is not very stable, and the stock market has taken quite a few extreme swings in the past several months. Before Tom invests his funds, he wants to assess the returns and risk of investing in U.S. Treasury Bonds versus the 2 stocks.
The economic experts have specified 5 possible scenarios at the end of the year. For each scenario, they have estimated the probability of the scenario occurring and the impact on returns from U.S. Treasury Bonds and the 2 stocks. Given this information, Tom has calculated the rate of return on a 10-year zero coupon for each scenario. The probabilities and returns are shown below for each scenario.
Write a 700- to 1,050-word risk and return analysis in which you address the following:
Bonds
- What is the return on investing $1,000 in U.S. Treasury Bonds if selling it after 1 year for $1,088?
- Graph the probability distribution for the 5 scenarios during the next year for the 10-year zero coupon Treasury Bonds.
Return on a 10-Year Zero Coupon Treasury Bond
| Scenario | Probability | Return |
|---|---|---|
| Worst Case | 0.15 | -18% |
| Bad Case | 0.25 | -3% |
| Most Likely Case | 0.35 | 6% |
| Good Case | 0.15 | 19% |
| Best Case | 0.10 | 28% |
Note: The total in the Probability column must equal 1.
Calculate the expected return on this bond given the probability distribution.
Stocks
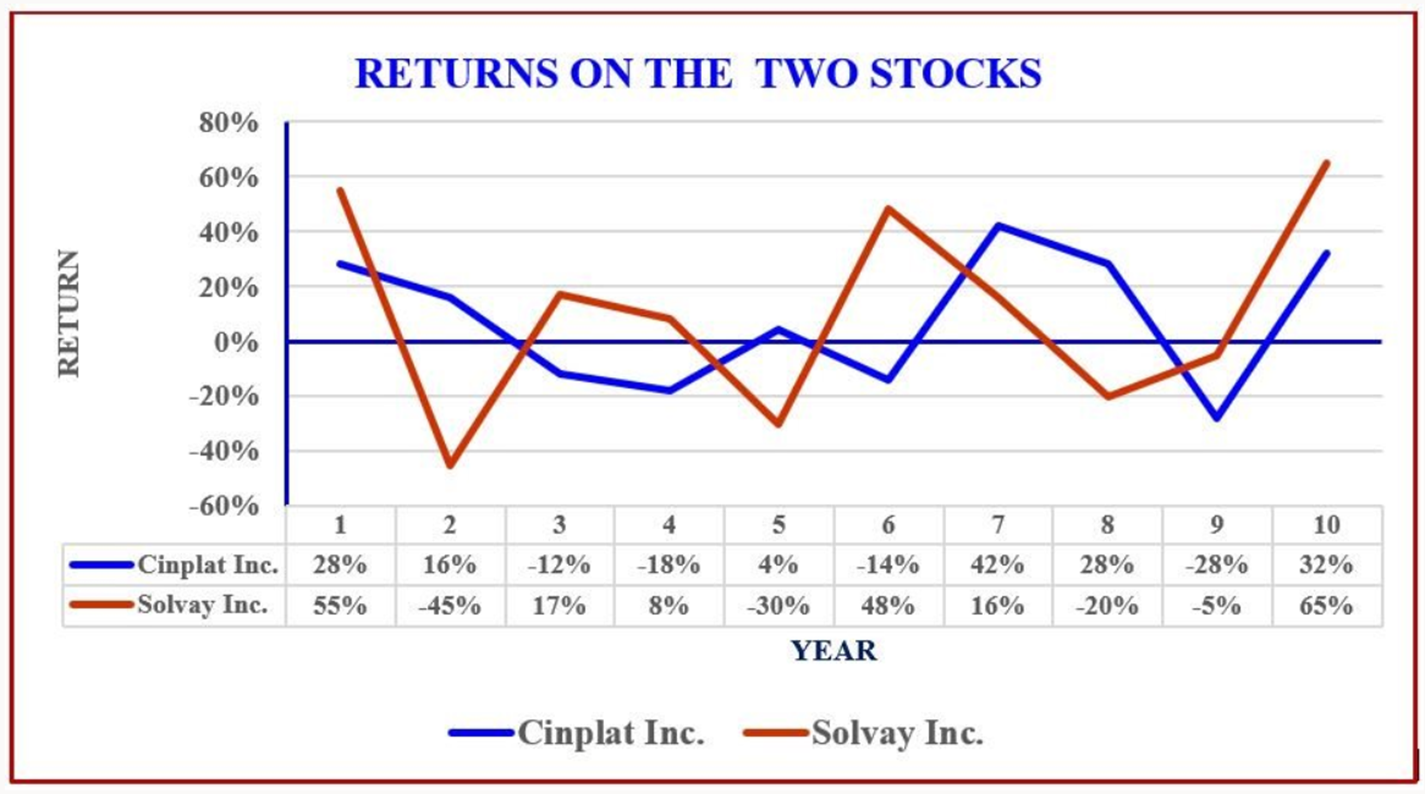
Calculate the expected returns for the 2 stocks, Cinplat Inc. and Solvay Inc., given the historical returns for the past 10 years.
Stock Returns
| Year | Market (S&P 500) | Cinplat Inc. | Solvay Inc. |
|---|---|---|---|
| 1 | 36% | 28% | 55% |
| 2 | 17% | 16% | -45% |
| 3 | 17% | -12% | 17% |
| 4 | -29% | -18% | 8% |
| 5 | -16% | 4% | -30% |
| 6 | 10% | -14% | 48% |
| 7 | 25% | 42% | 16% |
| 8 | -11% | 28% | -20% |
| 9 | -5% | -28% | -5% |
| 10 | 40% | 32% | 65% |
- Estimate the risk of each of these stocks. Which stock is riskier and why?
- If Tom invests $1MM in each of these stocks, what is the risk of the portfolio?
- If Tom invests 75% of $2MM in Cinplat Inc. and 25% in Solvay Inc., what is the risk of the portfolio?
- The graph of the returns from Cinplat Inc. and Solvay Inc. are shown below. What inferences can you derive from this chart?
Step by Step Solution
There are 3 Steps involved in it

Get step-by-step solutions from verified subject matter experts