

Question: could someone please only do the graph for me? Post Laboratory Exercises Create an X axis range of -400 C to +120 C. Your y
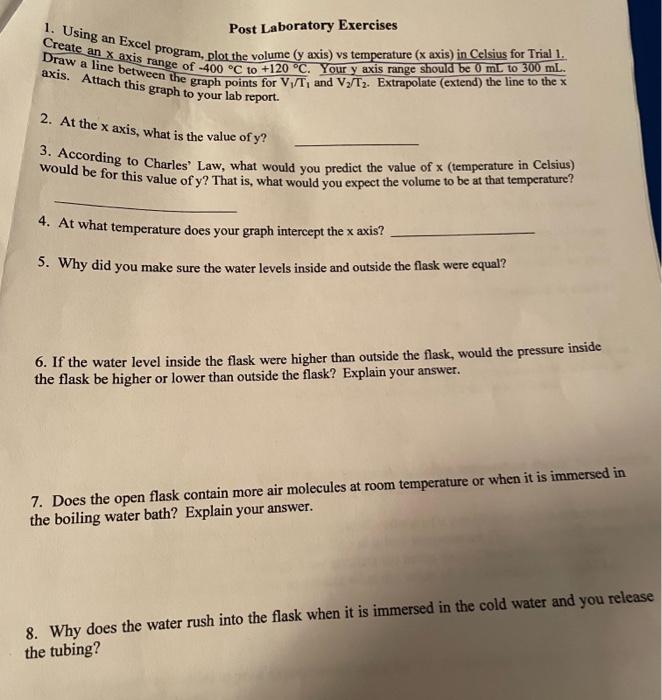
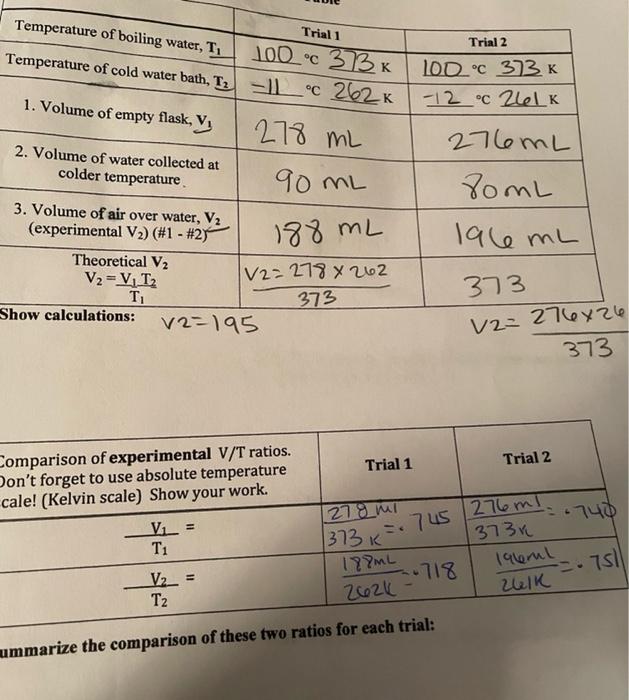
Post Laboratory Exercises Create an X axis range of -400 C to +120 C. Your y axis range should be 0 mL to 300 mL. 1. Using an Excel program, plot the volume (y axis) vs temperature (x axis) in Celsius for Trial 1. Draw a line between the graph points for VT, and V/T2. Extrapolate (extend) the line to the x axis. Attach this graph to your lab report. 2. At the x axis, what is the value of y? 3. According to Charles Law, what would you predict the value of x (temperature in Celsius) 4. At what temperature does your graph intercept the x axis? 5. Why did you make sure the water levels inside and outside the flask were equal? 6. If the water level inside the flask were higher than outside the flask, would the pressure inside the flask be higher or lower than outside the flask? Explain your answer. 7. Does the open flask contain more air molecules at room temperature or when it is immersed in the boiling water bath? Explain your answer. 8. Why does the water rush into the flask when it is immersed in the cold water and you release the tubing? Trial 1 Temperature of boiling water, T, 100c 373K Temperature of cold water bath, Tz - Lc 262 K Trial 2 100C 373 K -12 C 2616 1. Volume of empty flask, V 278 mL 2. Volume of water collected at colder temperature 276ML SomL 90 ML lale mL 3. Volume of air over water, V2 (experimental V2) (#1 - #27 Theoretical V2 V2 = V, T T Show calculations: V2=195 188 mL [/2=278 X 262 373 373 V2=276x26 21 373 Trial 1 Trial 2 Comparison of experimental V/T ratios. Don't forget to use absolute temperature cale! (Kelvin scale) Show your work. Vi = T1 278 mi 740 373 K = 745 276ml 13734 lalerul Zulk .rs V2_= T2 188mL -.718 2626 - mummarize the comparison of these two ratios for each trial
Step by Step Solution
There are 3 Steps involved in it

Get step-by-step solutions from verified subject matter experts