

Question: could use help getting liquidity ratio using attached income statement and balance sheet Starbucks 111.82 -1.59 (-1.40%) SBUX Income Statement Income I Annual Quarterly Period
could use help getting liquidity ratio using attached income statement and balance sheet
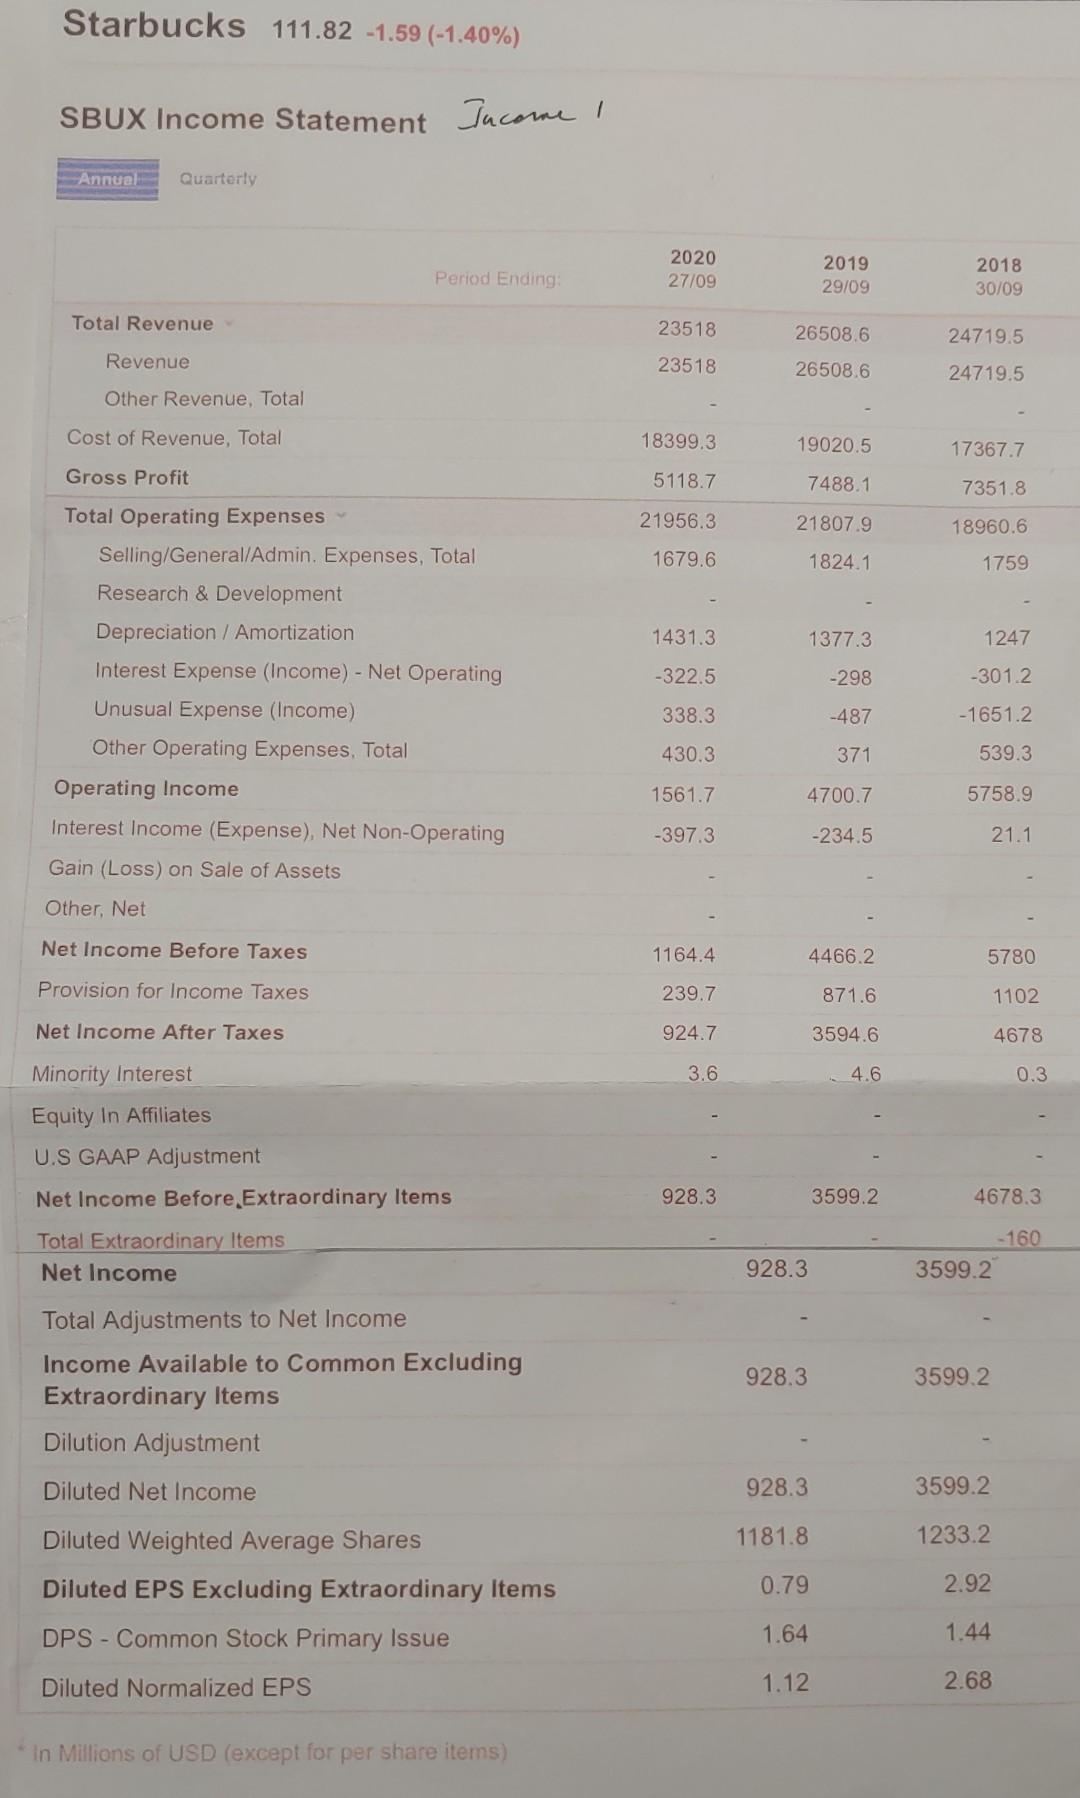
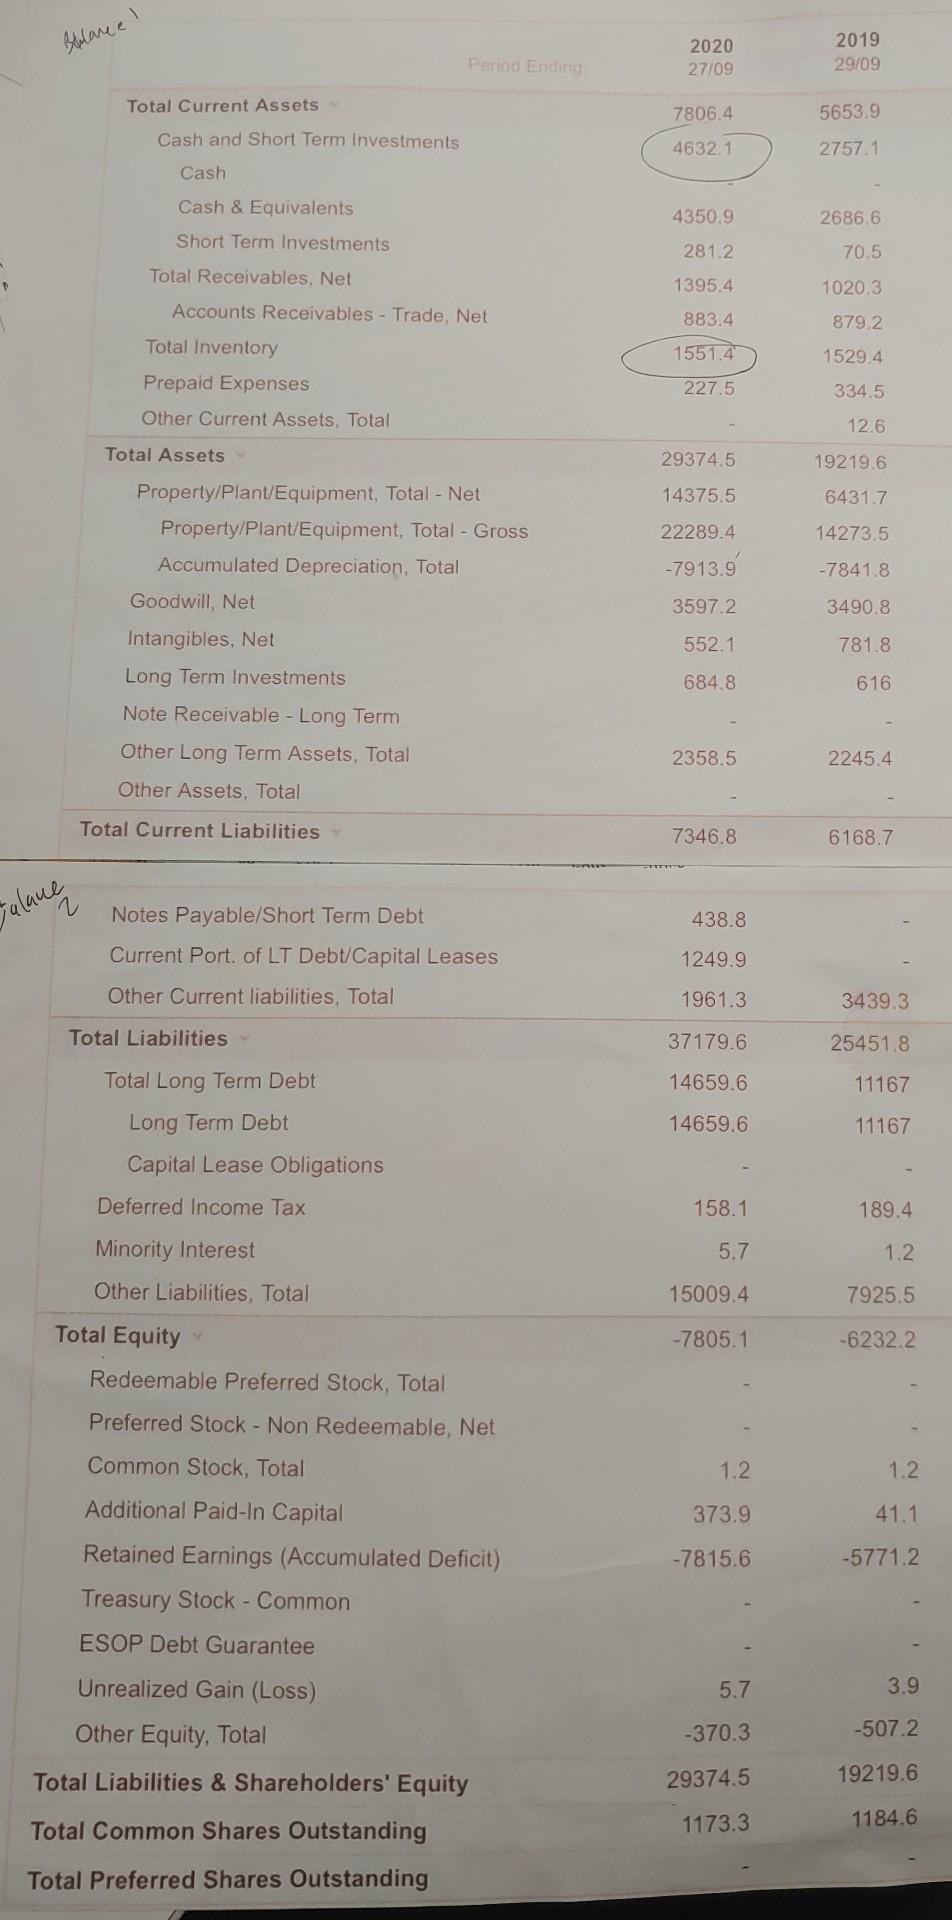
Starbucks 111.82 -1.59 (-1.40%) SBUX Income Statement Income I Annual Quarterly Period Ending 2020 27/09 2019 29/09 2018 30/09 Total Revenue 23518 26508.6 24719.5 Revenue 23518 26508.6 24719.5 Other Revenue, Total Cost of Revenue, Total 18399.3 19020.5 17367.7 Gross Profit 5118.7 7488.1 7351.8 21956.3 21807.9 18960.6 1679.6 1824.1 1759 1431.3 1377.3 1247 Total Operating Expenses Selling/General/Admin. Expenses, Total Research & Development Depreciation / Amortization Interest Expense (Income) - Net Operating Unusual Expense (Income) Other Operating Expenses. Total Operating Income -322.5 -298 -301.2 338.3 -487 -1651.2 430.3 371 539.3 1561.7 4700.7 5758.9 Interest Income (Expense), Net Non-Operating -397.3 -234.5 21.1 Gain (Loss) on Sale of Assets Other, Net Net Income Before Taxes 1164.4 4466.2 5780 Provision for Income Taxes 239.7 871.6 1102 Net Income After Taxes 924.7 3594.6 4678 3.6 4.6 0.3 Minority Interest Equity In Affiliates U.S GAAP Adjustment Net Income Before Extraordinary Items 928.3 3599.2 4678.3 Total Extraordinary Items Net Income - 160 3599.2 928.3 Total Adjustments to Net Income Income Available to Common Excluding Extraordinary Items Dilution Adjustment 928.3 3599.2 Diluted Net Income 928.3 3599.2 1181.8 1233.2 Diluted Weighted Average Shares Diluted EPS Excluding Extraordinary Items DPS - Common Stock Primary Issue 0.79 2.92 1.64 1.44 Diluted Normalized EPS 1.12 2.68 in Millions of USD (except for per share items) Balance ! Pariad Ending 2020 27/09 2019 29/09 Total Current Assets 7806.4 5653.9 4632.1 2757.1 Cash and Short Term Investments Cash Cash & Equivalents Short Term Investments 4350.9 2686.6 281.2 70.5 1395.4 1020.3 883.4 Total Receivables, Net Accounts Receivables - Trade, Net Total Inventory Prepaid Expenses 879.2 1551.4 1529.4 227.5 3345 Other Current Assets. Total 12.6 Total Assets 29374.5 19219.6 14375.5 6431.7 22289.4 14273.5 -7913.9 -7841.8 3597.2 3490.8 Property/Plant/Equipment, Total - Net Property/Plant/Equipment, Total - Gross Accumulated Depreciation. Total Goodwill, Net Intangibles, Net Long Term Investments Note Receivable - Long Term Other Long Term Assets, Total Other Assets, Total 552.1 781.8 684.8 616 2358.5 2245.4 Total Current Liabilities 7346.8 6168.7 Jalane 2 438.8 Notes Payable/Short Term Debt Current Port of LT Debt/Capital Leases 1249.9 Other Current liabilities, Total 1961.3 3439.3 Total Liabilities 37179.6 25451.8 14659.6 11167 Total Long Term Debt Long Term Debt Capital Lease Obligations 14659.6 11167 Deferred Income Tax 158.1 189.4 Minority Interest 5.7 1.2 Other Liabilities. Total 15009.4 7925.5 Total Equity -7805.1 -6232.2 Redeemable Preferred Stock, Total Preferred Stock - Non Redeemable, Net 1.2. 1.2 373.9 41.1 -7815.6 -5771.2 Common Stock, Total Additional Paid-In Capital Retained Earnings (Accumulated Deficit) Treasury Stock - Common ESOP Debt Guarantee Unrealized Gain (Loss) Other Equity, Total Total Liabilities & Shareholders' Equity Total Common Shares Outstanding 5.7 3.9 -370.3 -507.2 29374.5 19219.6 1173.3 1184.6 Total Preferred Shares Outstanding
Step by Step Solution
There are 3 Steps involved in it

Get step-by-step solutions from verified subject matter experts