

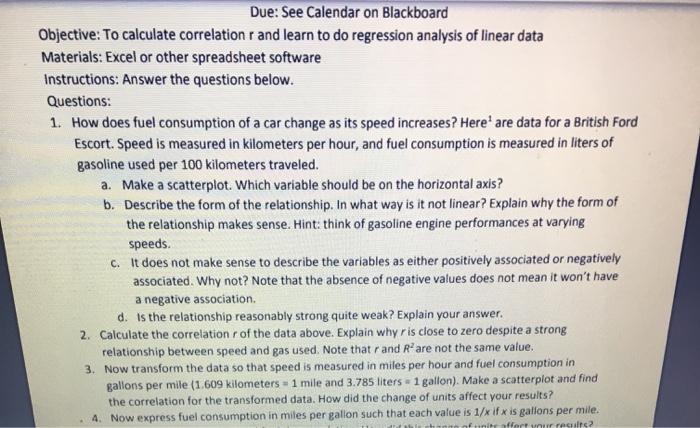
Question: Could you answer 1-4? i have the chart data in picture 2 4. is no longer cut off :) Due: See Calendar on Blackboard Objective:
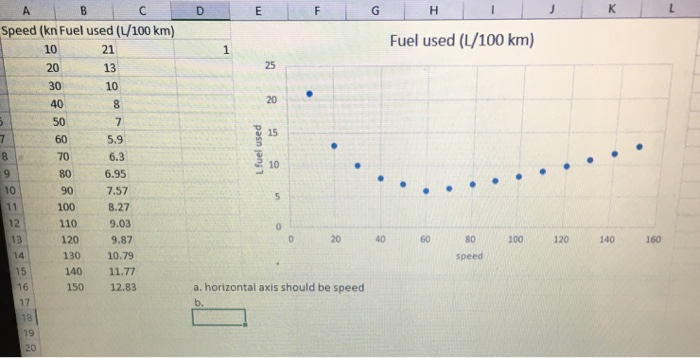
Could you answer 1-4? i have the chart data in picture 2
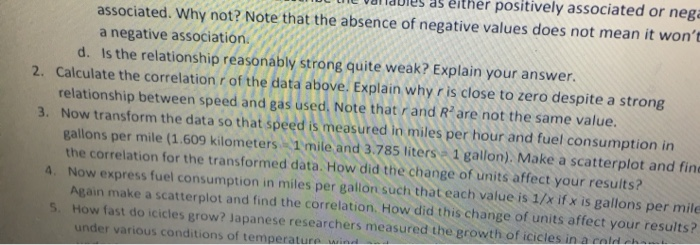
4. is no longer cut off :)
Step by Step Solution
There are 3 Steps involved in it
1 Expert Approved Answer
Step: 1 Unlock

Question Has Been Solved by an Expert!
Get step-by-step solutions from verified subject matter experts
Step: 2 Unlock
Step: 3 Unlock