

Question: Could you answered and explained in excel, please 4. Use the following table to calculate the percentage increase in the number of cases between 4/29/20
 Could you answered and explained in excel, please
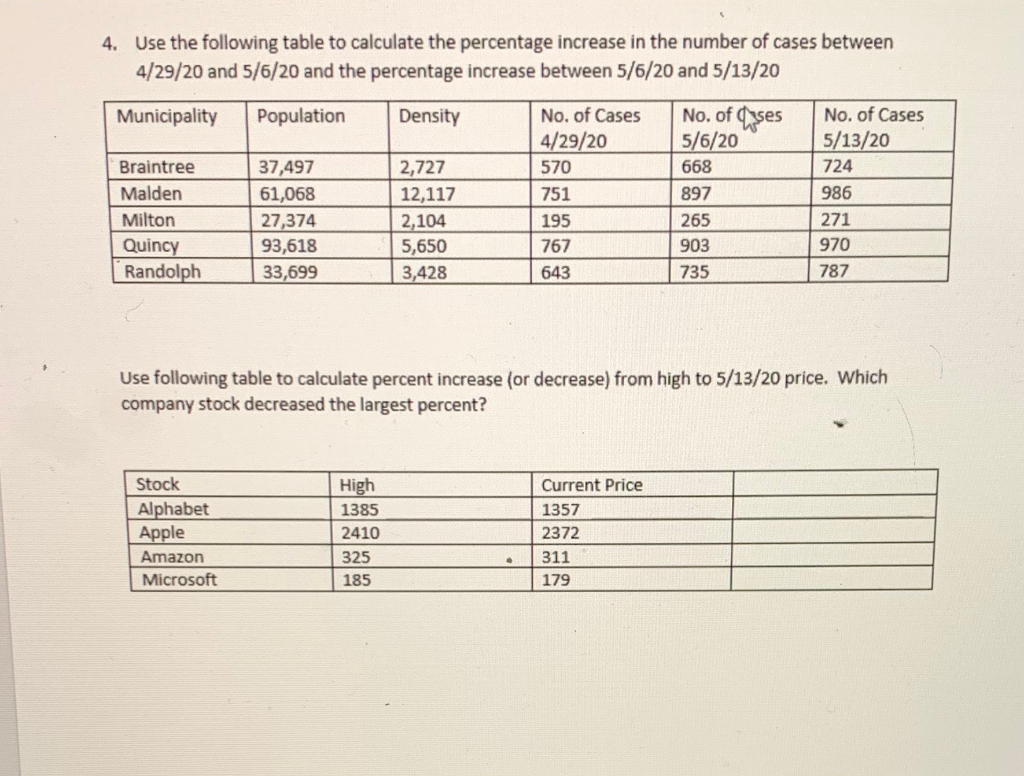
4. Use the following table to calculate the percentage increase in the number of cases between 4/29/20 and 5/6/20 and the percentage increase between 5/6/20 and 5/13/20 Municipality Population Density No. of Cases No. of Cases No. of Cases 4/29/20 5/6/20 5/13/20 Braintree 37,497 2,727 570 668 724 Malden 61,068 12,117 751 897 986 Milton 27,374 2,104 195 265 271 Quincy 93,618 5,650 767 903 970 Randolph 33,699 3,428 643 735 787 Use following table to calculate percent increase or decrease) from high to 5/13/20 price. Which company stock decreased the largest percent? Stock Alphabet Apple Amazon Microsoft High 1385 2410 325 185 Current Price 1357 2372 311 179
Step by Step Solution
There are 3 Steps involved in it

Get step-by-step solutions from verified subject matter experts