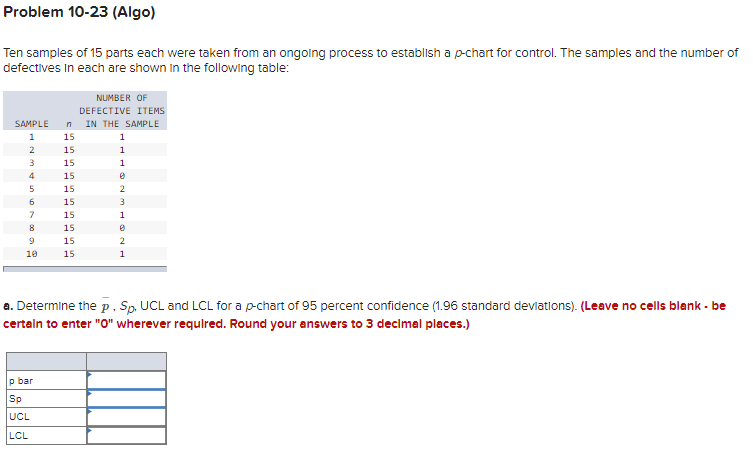
Question: Could you explain me this problem, please? Problem 10-23 (Algo) Ten samples of 15 parts each were taken from an ongoing process to establish a

Could you explain me this problem, please?

Could you explain me this problem, please?

Problem 10-23 (Algo) Ten samples of 15 parts each were taken from an ongoing process to establish a p-chart for control. The samples and the number of defectives in each are shown in the following table: WN SAMPLE 1 2 3 4 5 6 7 8 NUMBER OF DEFECTIVE ITEMS n IN THE SAMPLE 15 1 15 1 15 1 15 15 2 15 3 15 1 15 15 2 15 1 9 10 a. Determine the p, Sp, UCL and LCL for a p-chart of 95 percent confidence (1.96 standard deviations). (Leave no cells blank - be certain to enter "0" wherever required. Round your answers to 3 decimal places.) p bar Sp UCL LCL

Step by Step Solution

There are 3 Steps involved in it

1 Expert Approved Answer
Step: 1 Unlock blur-text-image
Question Has Been Solved by an Expert!

Get step-by-step solutions from verified subject matter experts

Step: 2 Unlock
Step: 3 Unlock

Students Have Also Explored These Related General Management Questions!