

Question: could you give me explanations on problem 3 ? I am stuck and do need your help. Thanks ! I also give you reference. IJIUHGI
could you give me explanations on problem 3 ? I am stuck and do need your help. Thanks !
I also give you reference.
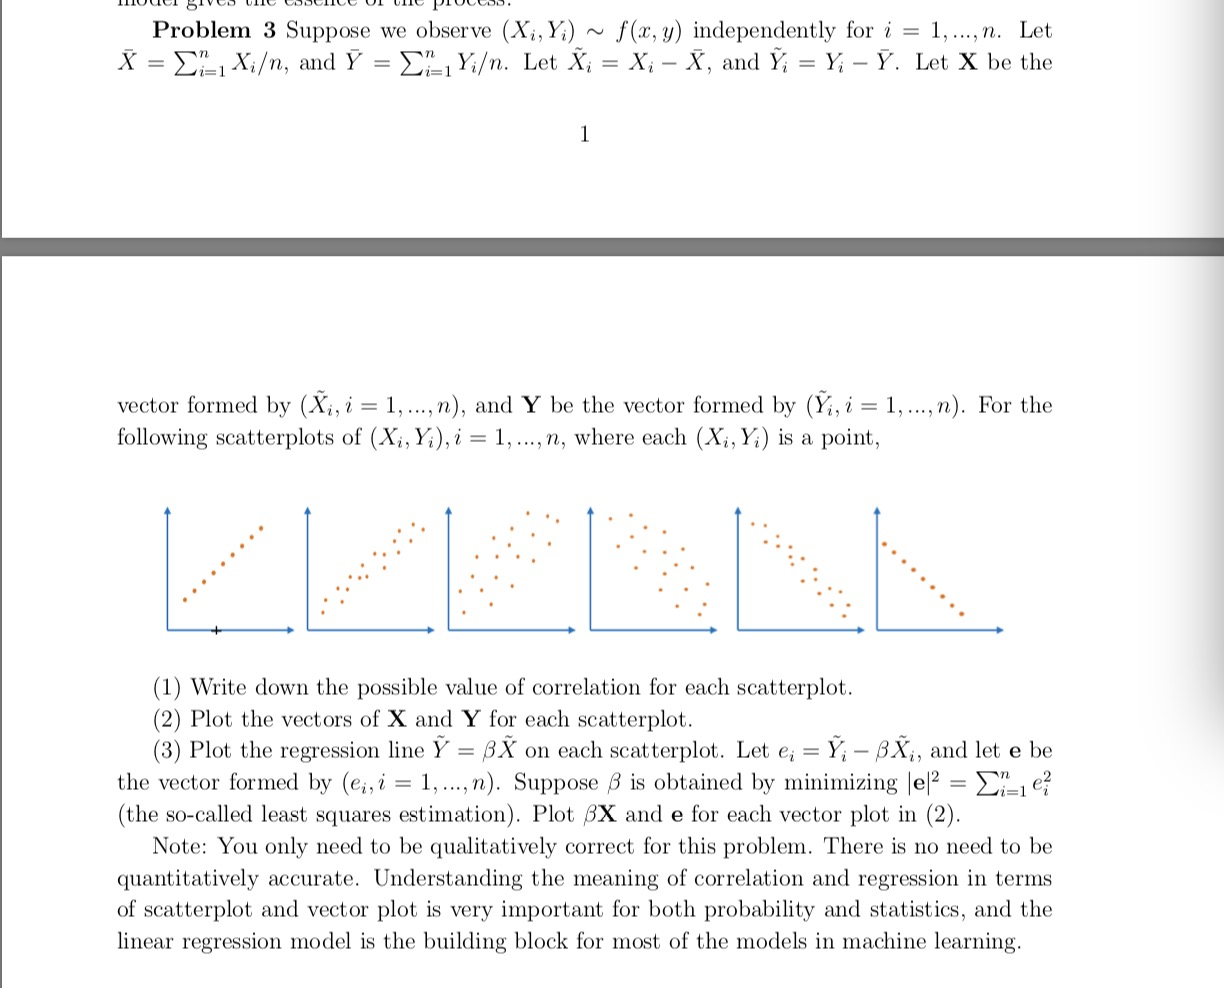
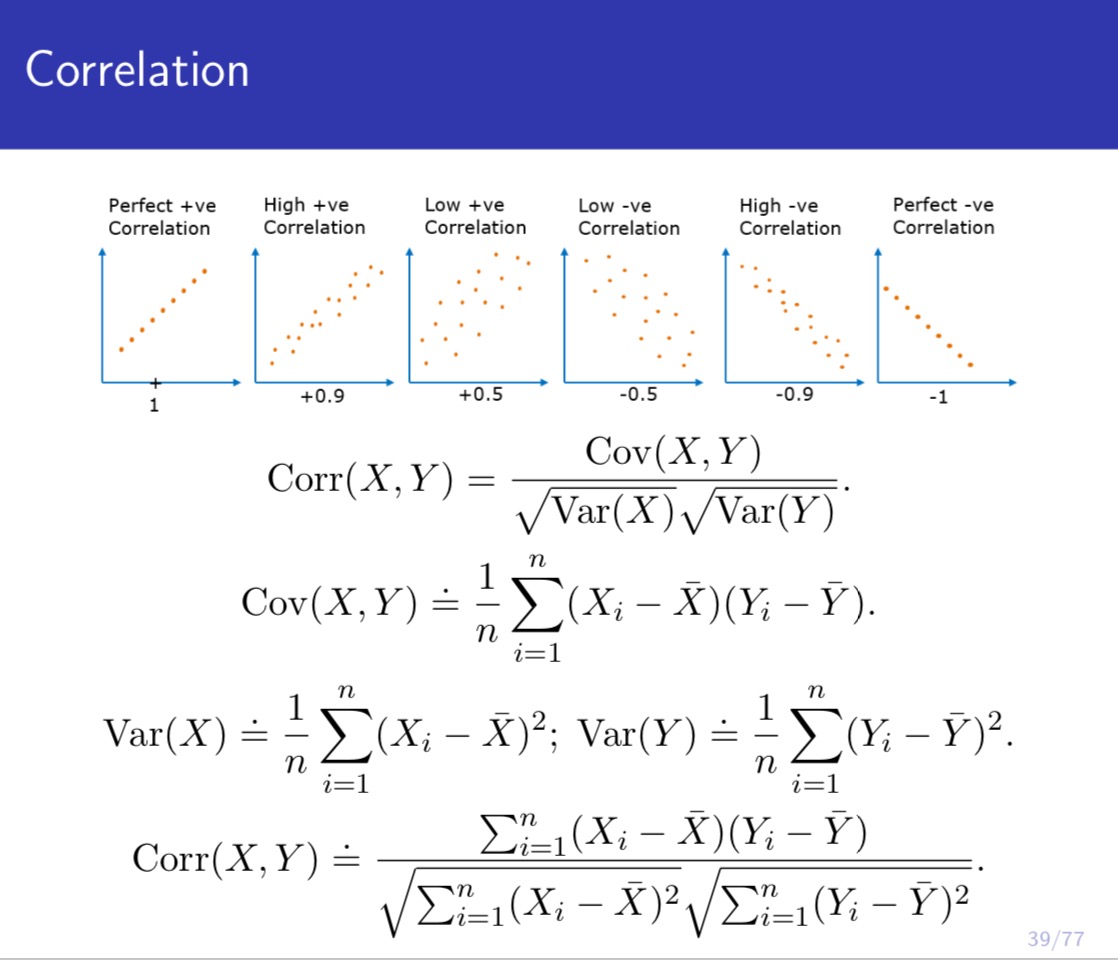
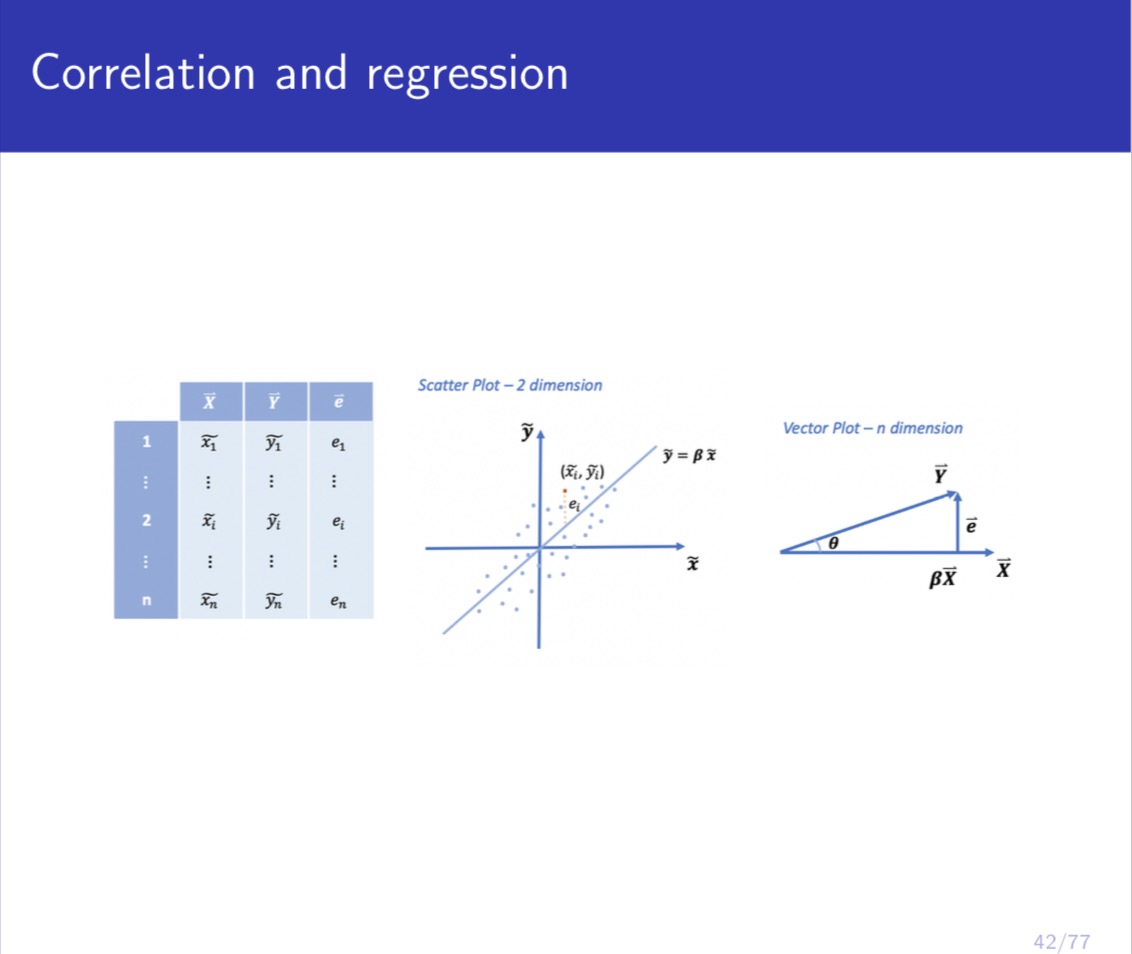
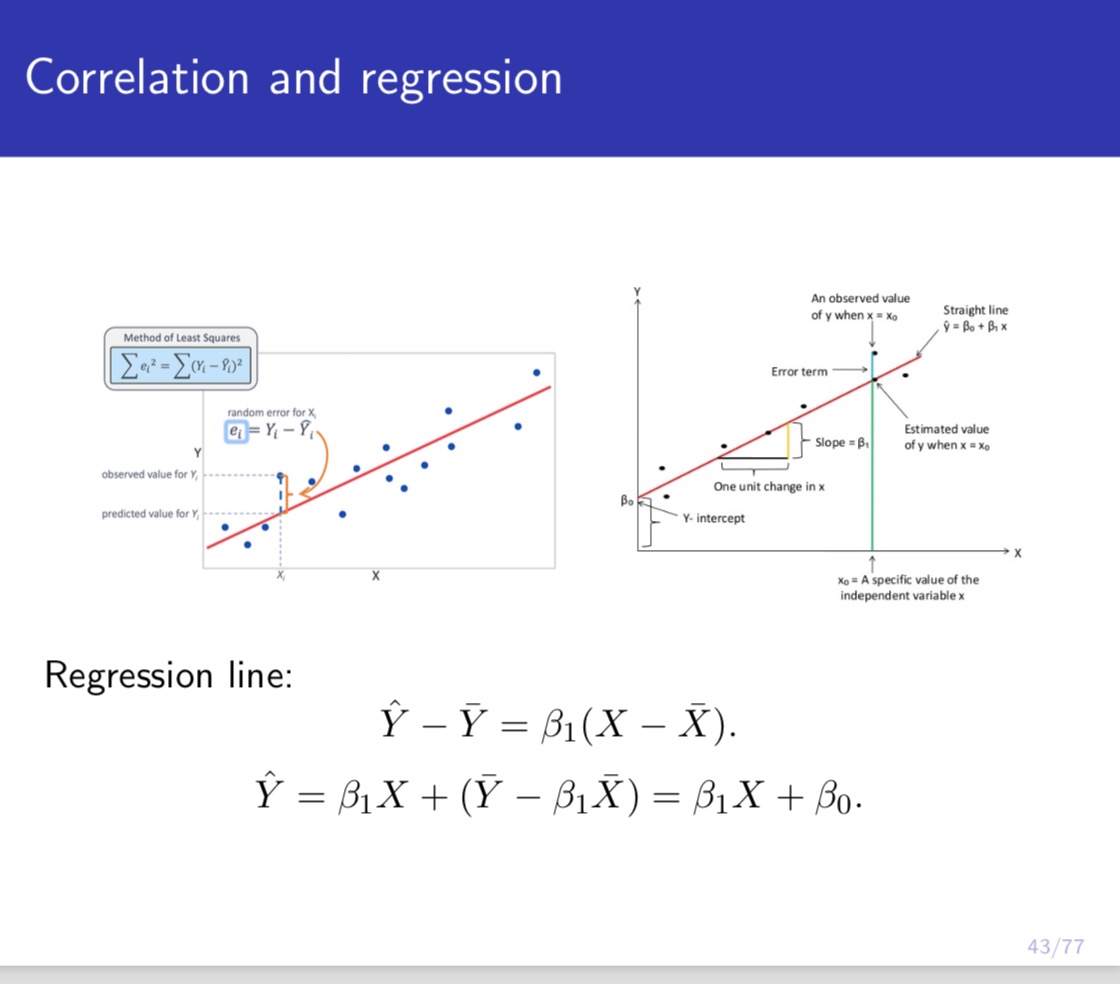
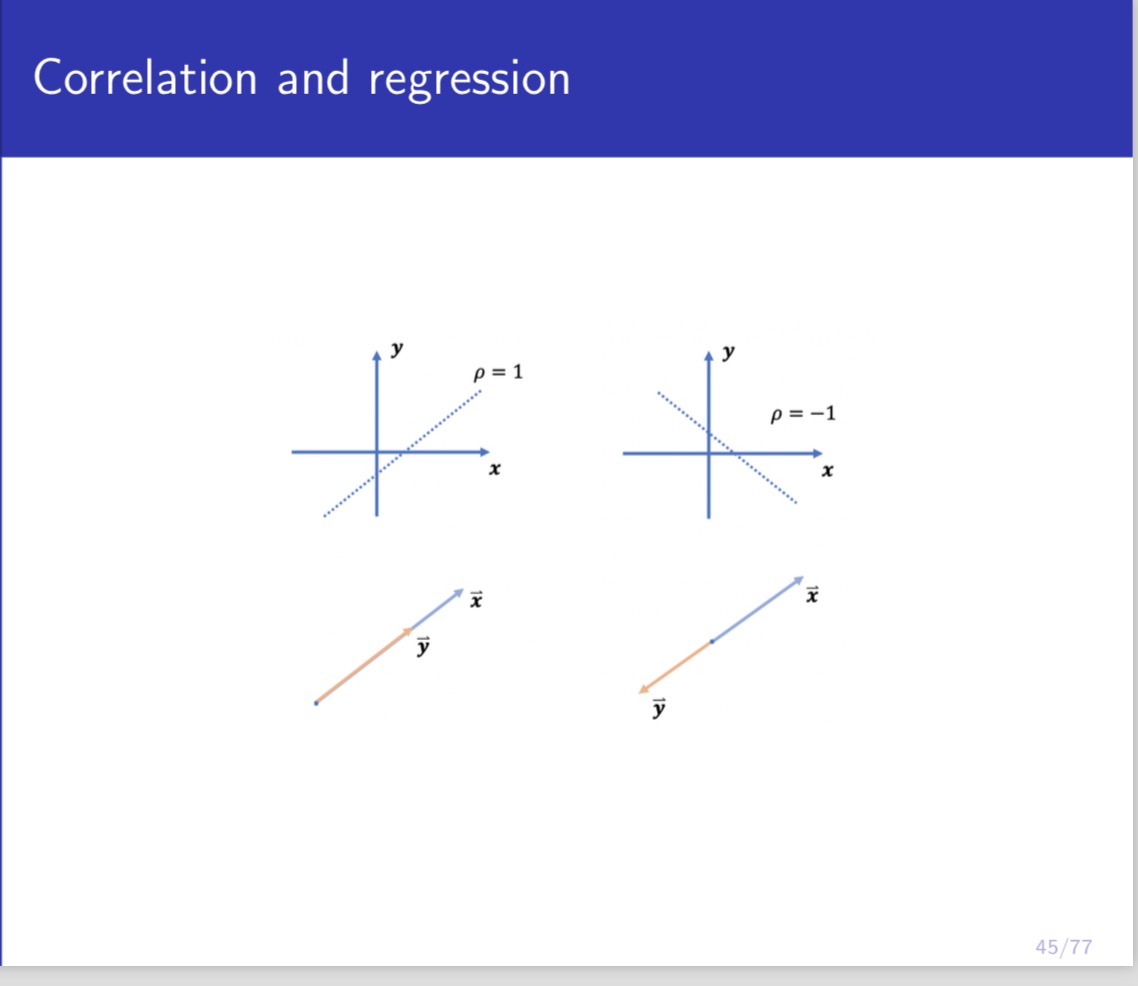
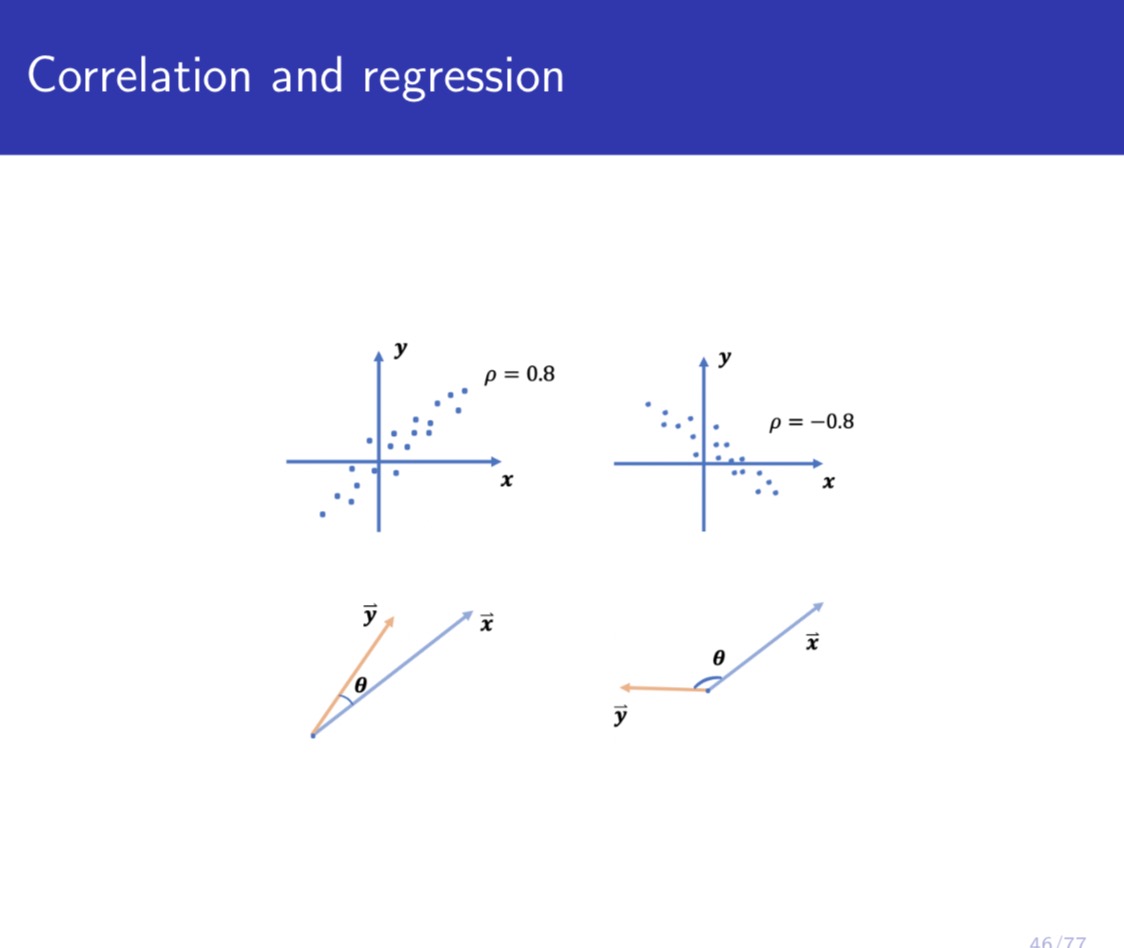
IJIUHGI atvco LII-JG maul-IMO Ul- ULJG PLUUWOI Problem 3 Suppose we observe (Xh) ~ f(a:,y) independently for i = 1,...,n. Let X = ELIXi, and 37' = ELLE. Let X1: = X,- - X', and Y; = Y; - )7. Let X be the vector formed by (22.4 = 1, ...,n), and Y be the vector formed by (hi = l, ...,n). For the following scatterplots of (Xi,}';;),i = l, ...,n, where each (Xi,}';) is a point, (1) Write down the possible value of correlation for each scatterplot. (2) Plot the vectors of X and Y for each scatterplot. (3) Plot the regression line 37' = {3}? on each scatterplot. Let e; = )7} - B)?\" and let e be the vector formed by (chi = 1, ...,n). Suppose is obtained by minimizing le|2 = 11:1 61? (the so-called least squares estimation). Plot 6X and e for each vector plot in (2). Note: You only need to be qualitatively correct for this problem. There is no need to be quantitatively accurate. Understanding the meaning of correlation and regression in terms of scatterplot and vector plot is very important for both probability and statistics, and the linear regression model is the building block for most of the models in machine learning. Correlation Perfect +ve High +ve Low +ve Low -ve High -ve Perfect -ve Correlation Correlation Correlation Correlation Correlation Correlation -1 1 +0.9 +0.5 -0.5 -0.9 Corr(X, Y) = Cov (X, Y) Var(X) Var(Y) n Cov (X, Y) = n (Xi - X ) ( Yi - Y). i=1 n n Var ( X ) = _ E( X; - X) 2; Var ( Y ) = = [( Y, - Y)2. n n i=1 i=1 Corr(X, Y) = ELI(Xi - X) ( Yi - Y) Et(Xi - X)? VEL ( Yi - Y)2 39/77\fCorrelation and regression An observed value of y when x = Xo Straight line 9 = Bo + Bix Method of Least Squares Error term random error for X e1= Yi - Y Slope = B, Estimated value of y when x = Xo observed value for Y, One unit change in x Bo predicted value for Y, -- Y- intercept Xo = A specific value of the independent variable x Regression line: Y - Y = BI( X - X). Y = BIX+(Y - BIX) =BIX+ Bo. 43/77\f\f
Step by Step Solution
There are 3 Steps involved in it

Get step-by-step solutions from verified subject matter experts