

Question: Could you help me? Question 1 (1 point) ~ Saved In Ohio, the percentage of students in grades 9-12 who drank regular soda/pop at least
Could you help me?
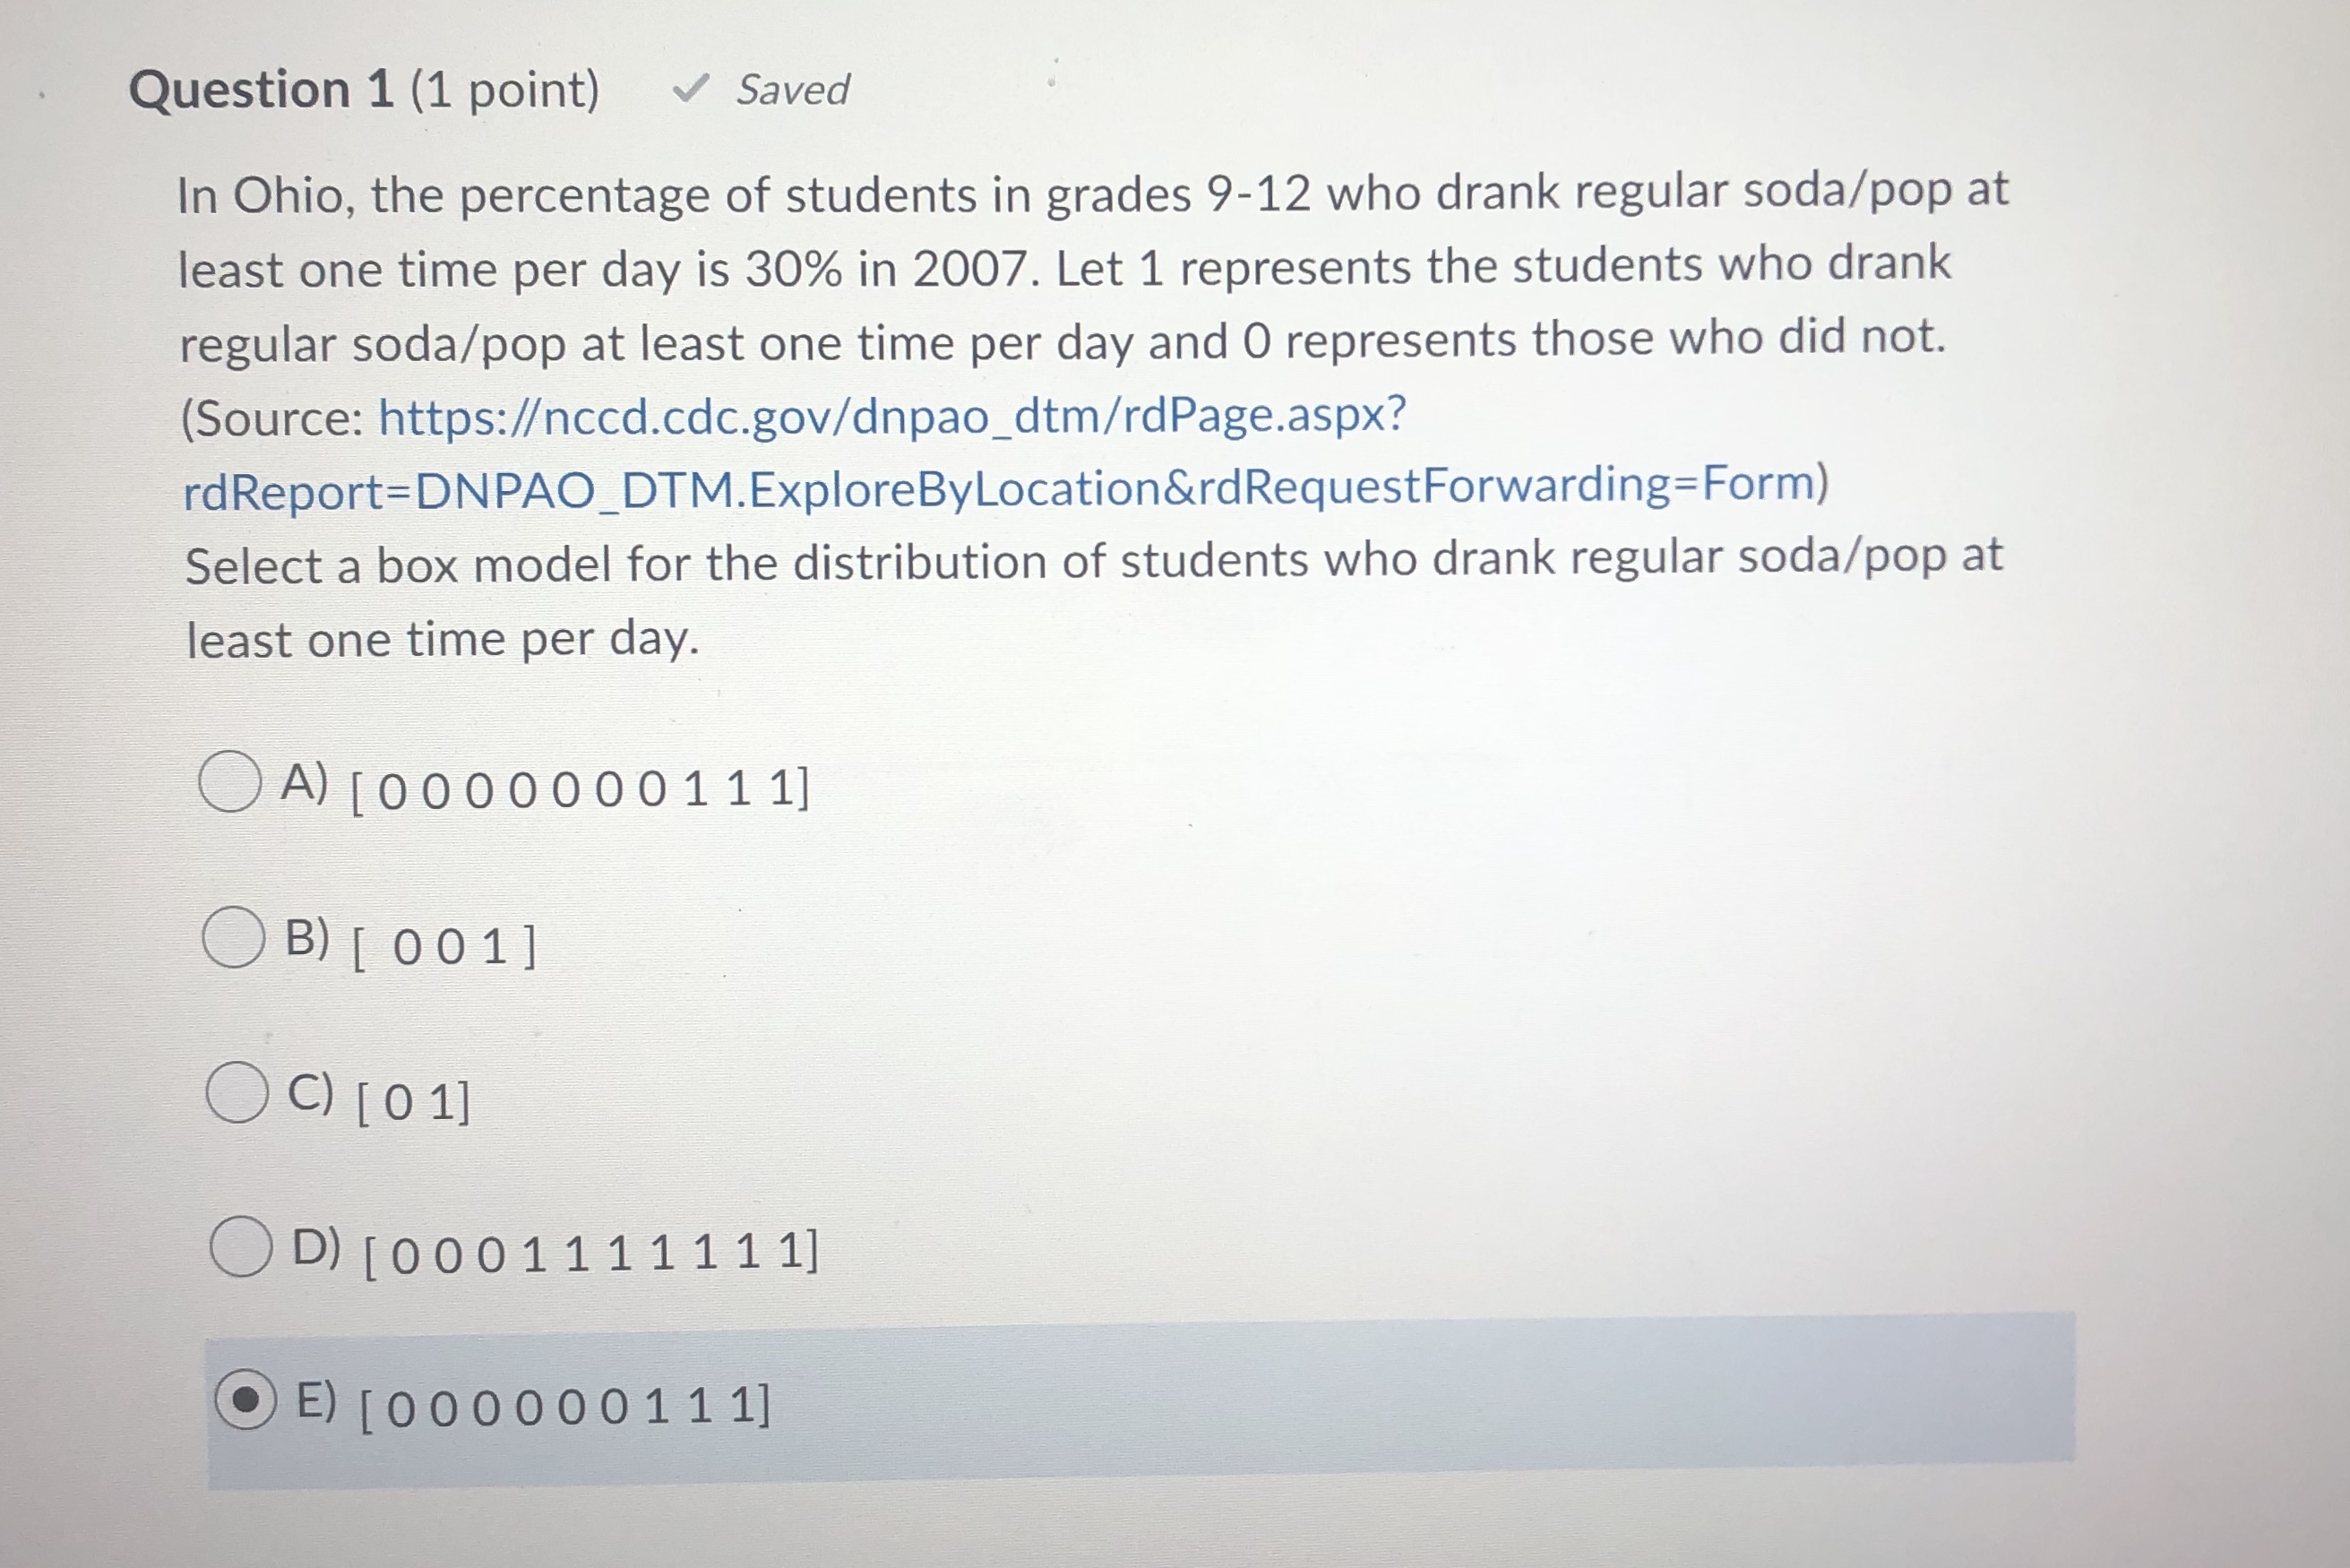
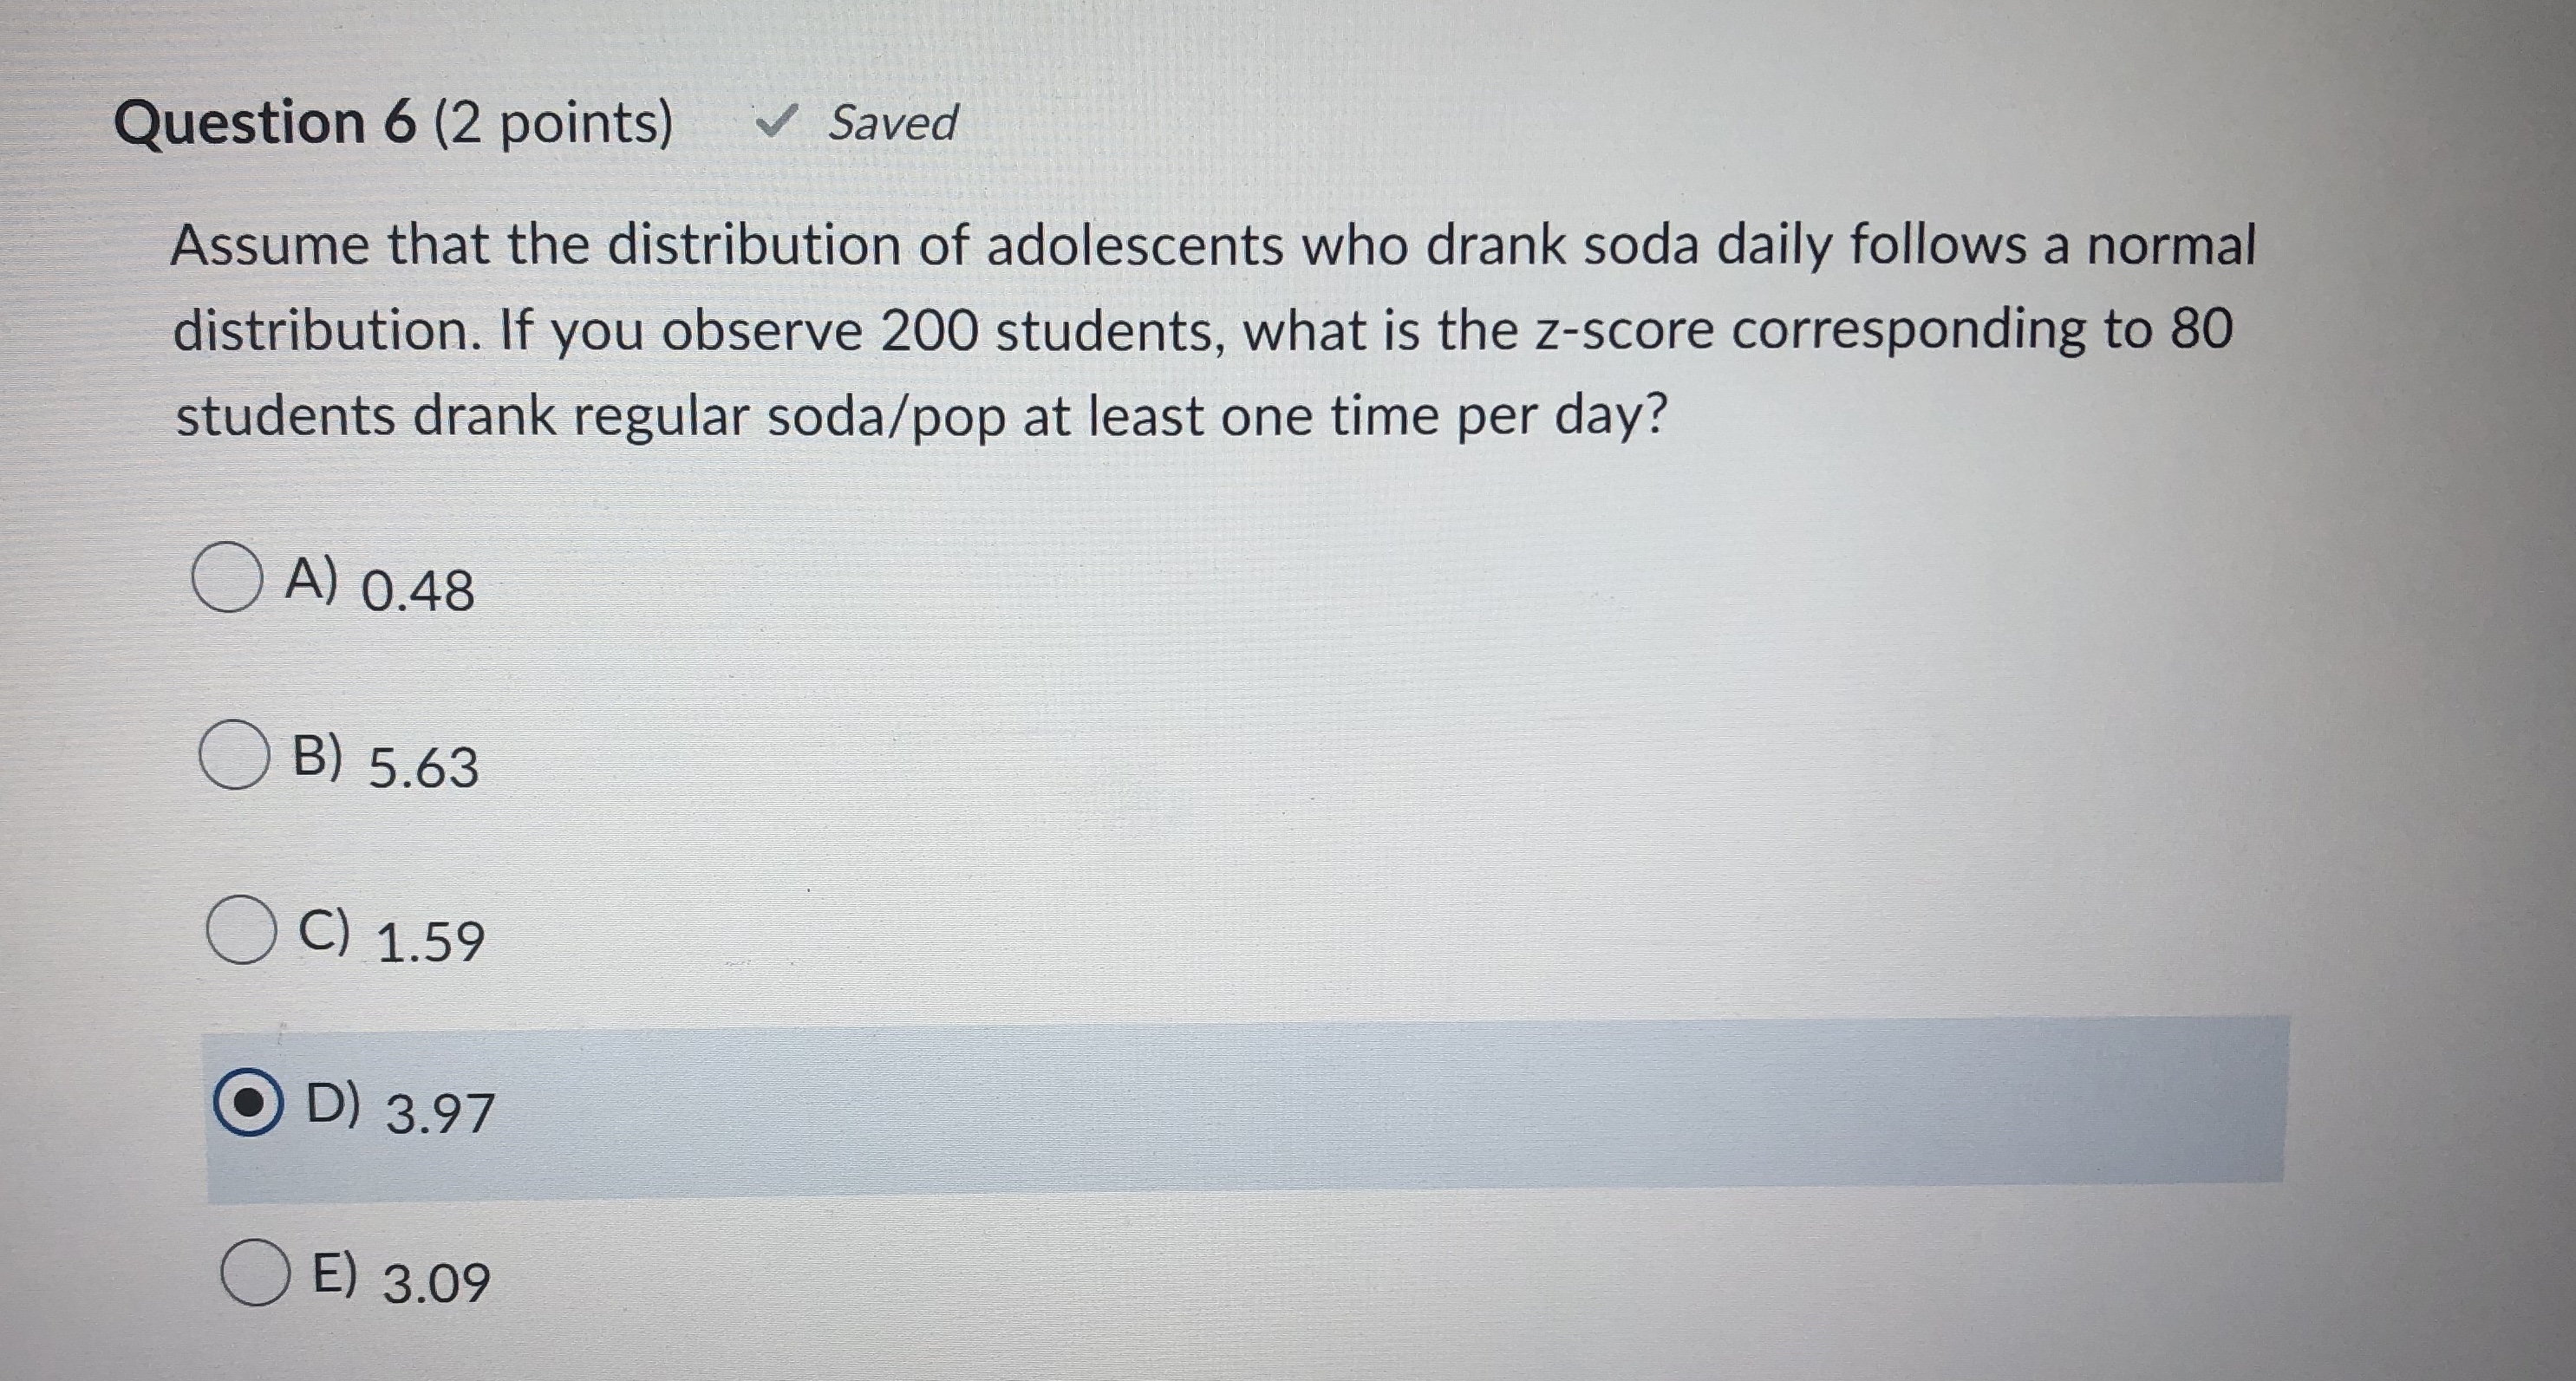
Question 1 (1 point) ~ Saved In Ohio, the percentage of students in grades 9-12 who drank regular soda/pop at least one time per day is 30% in 2007. Let 1 represents the students who drank regular soda/pop at least one time per day and O represents those who did not. (Source: https:/ccd.cdc.gov/dnpao_dtm/rdPage.aspx? rdReport=DNPAO_DTM.ExploreByLocation&rdRequestForwarding=Form) Select a box model for the distribution of students who drank regular soda/pop at least one time per day. A) [000 0 0 0 01 1 1] OB) [ 0 01] O c) [01] OD) [0001111111] E) [00 0 0 0 0 1 1 1]Question 6 (2 points) Saved Assume that the distribution of adolescents who drank soda daily follows a normal distribution. If you observe 200 students, what is the z-score corresponding to 80 students drank regular soda/pop at least one time per day? A) 0.48 O B) 5.63 C) 1.59 OD) 3.97 O E) 3.09
Step by Step Solution
There are 3 Steps involved in it

Get step-by-step solutions from verified subject matter experts