

Question: Could you help me with this? 2. For setting price target scenarios (EPS forecast x valuation multiple), when using the upside EPS scenario, it's best
Could you help me with this?
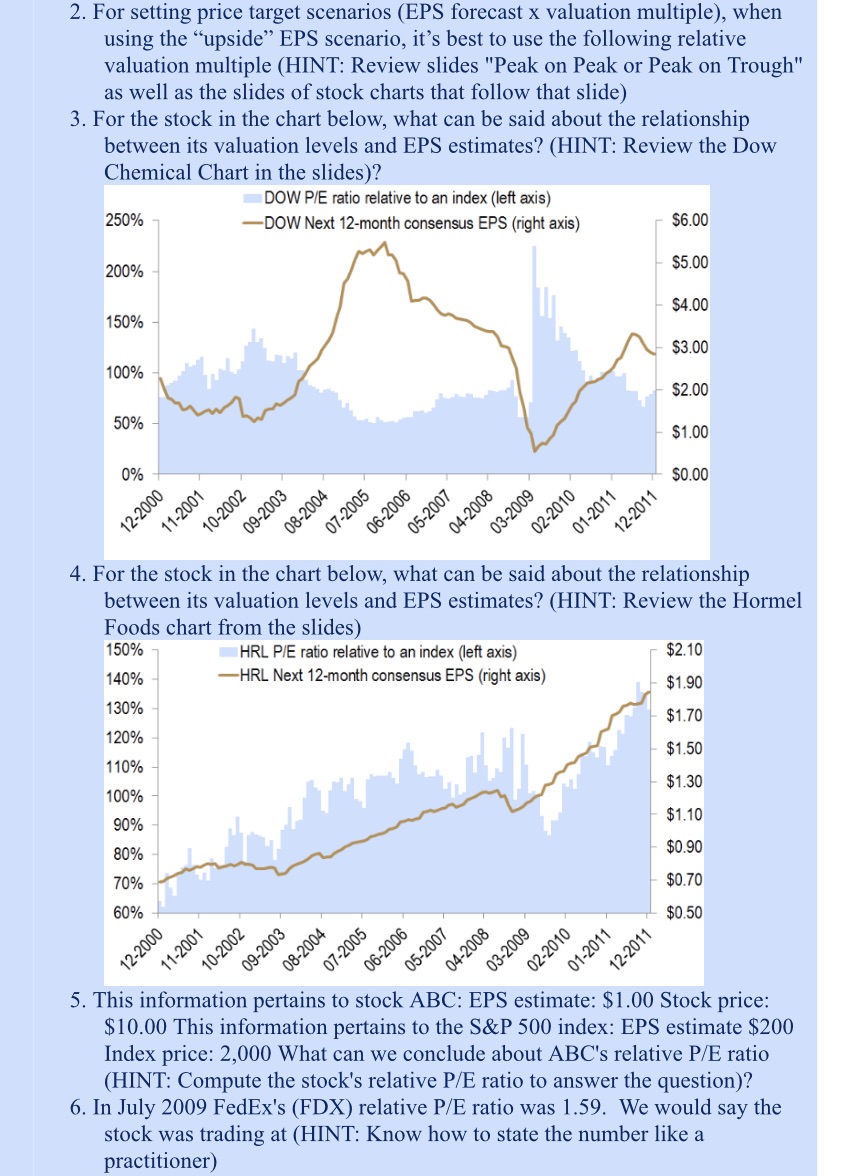
2. For setting price target scenarios (EPS forecast x valuation multiple), when using the "upside" EPS scenario, it's best to use the following relative valuation multiple (HINT: Review slides "Peak on Peak or Peak on Trough" as well as the slides of stock charts that follow that slide) 3. For the stock in the chart below, what can be said about the relationship between its valuation levels and EPS estimates? (HINT: Review the Dow Chemical Chart in the slides)? DOW P/E ratio relative to an index (left axis) 250% -DOW Next 12-month consensus EPS (right axis) $6.00 200% $5.00 $4.00 150% $3.00 100% $2.00 50% $1.00 0% $0.00 12-2000 1-2001 -2002 2005 09-2003 08-2004 06-2006 05-2007 04-2008 03-2009 02-2010 01-2011 07-2 12-2 4. For the stock in the chart below, what can be said about the relationship between its valuation levels and EPS estimates? (HINT: Review the Hormel Foods chart from the slides) 150% HRL P/E ratio relative to an index (left axis) $2.10 140% -HRL Next 12-month consensus EPS (right axis) $1.90 130% $1.70 120% $1.50 110% $1.30 100% 90% $1.10 80% $0.90 70% $0.70 60% $0.50 12-2000 11-2001 10-2002 09-2003 08-2004 07-2005 06-2006 05-2007 04-2008 3-200 01-2011 02-2 12-201 5. This information pertains to stock ABC: EPS estimate: $1.00 Stock price: $10.00 This information pertains to the S&P 500 index: EPS estimate $200 Index price: 2,000 What can we conclude about ABC's relative P/E ratio (HINT: Compute the stock's relative P/E ratio to answer the question)? 6. In July 2009 FedEx's (FDX) relative P/E ratio was 1.59. We would say the stock was trading at (HINT: Know how to state the number like a practitioner)
Step by Step Solution
There are 3 Steps involved in it

Get step-by-step solutions from verified subject matter experts