

Question: could you help with excel graphs and formulas over the course of 12 months as the graph below shows 1. Using the Base Case project
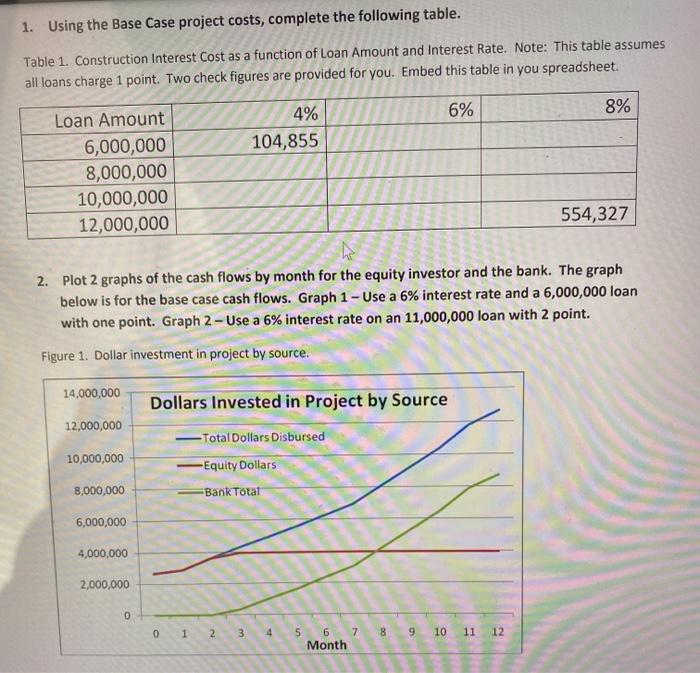
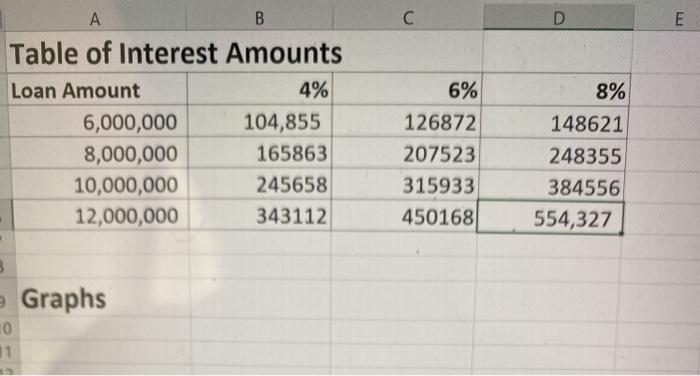
1. Using the Base Case project costs, complete the following table. Table 1. Construction Interest Cost as a function of Loan Amount and Interest Rate. Note: This table assumes all loans charge 1 point. Two check figures are provided for you. Embed this table in you spreadsheet. 6% 8% 4% 104,855 Loan Amount 6,000,000 8,000,000 10,000,000 12,000,000 554,327 hie 2. Plot 2 graphs of the cash flows by month for the equity investor and the bank. The graph below is for the base case cash flows. Graph 1 - Use a 6% interest rate and a 6,000,000 loan with one point. Graph 2 - Use a 6% interest rate on an 11,000,000 loan with 2 point. Figure 1. Dollar investment in project by source. 14,000,000 Dollars Invested in Project by Source 12,000,000 Total Dollars Disbursed 10,000,000 -Equity Dollars Bank Total 8,000,000 6,000,000 4,000,000 2,000,000 0 0 1 2 3 4 8 9 10 11 5 6 7 Month 12 A B D E 8% Table of Interest Amounts Loan Amount 4% 6,000,000 104,855 8,000,000 165863 10,000,000 245658 12,000,000 343112 6% 126872 207523 315933 450168 148621 248355 384556 554,327 Graphs 10 11
Step by Step Solution
There are 3 Steps involved in it

Get step-by-step solutions from verified subject matter experts