

Question: could you please do the ones highlighted :) Use the following financial statements for Lake of Egypt Marina to answer Problems Lake of Egypt Marina,
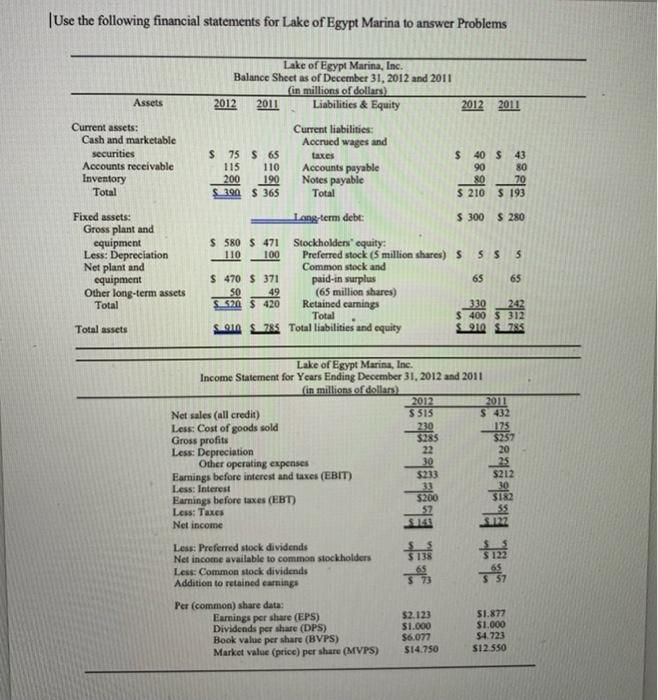
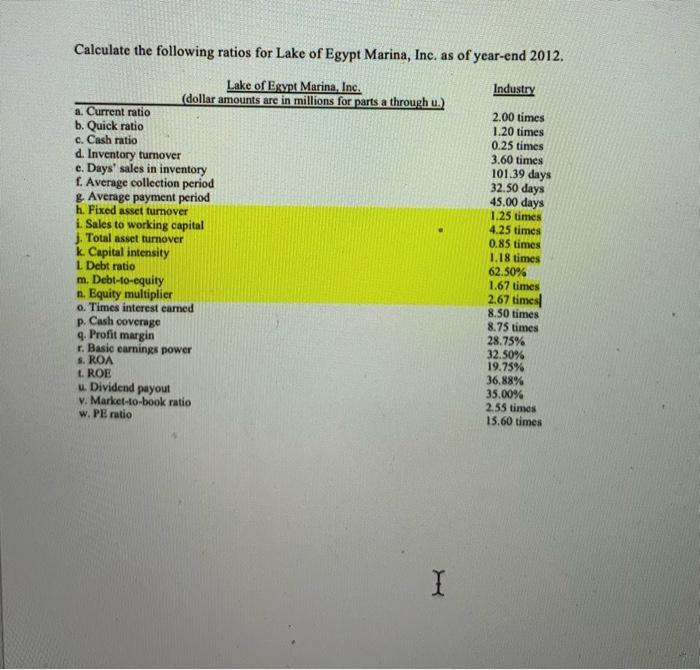
Use the following financial statements for Lake of Egypt Marina to answer Problems Lake of Egypt Marina, Inc. Balance Sheet as of December 31, 2012 and 2011 (in millions of dollars) 2012 2011 Liabilities & Equity Assets 2012 2011 Current assets: Cash and marketable securities Accounts receivable Inventory Total S 75 65 115 110 200 190 390 S 365 Current liabilities Accrued wages and taxes Accounts payable Notes payable Total $ 40 $ 43 90 80 80 70 $ 210 $ 193 Long term debt: $ 300 $ 280 Fixed assets Gross plant and equipment Less: Depreciation Net plant and equipment Other long-term assets Total 65 $ 580 $ 471 Stockholders equity: 110 100 Preferred stock (5 million shares) S SS 5 Common stock and $ 470 $ 371 paid-in surplus 65 50 49 (65 million shares) S520 $ 420 Retained caring 330 242 Total $ 400 $ 312 91 785 Total liabilities and equity 910 785 Total assets Lake of Egypt Marina, Inc. Income Statement for Years Ending December 31, 2012 and 2011 (in millions of dollars) 2012 2011 Net sales (all credit) S 515 $ 432 Less: Cost of goods sold 175 Gross profits Less: Depreciation Other operating expenses 30 Earnings before interest and taxes (EBIT) $233 Less: Interest 33 Earnings before taxes (EBT) $200 Less: Taxes 57 Net income S 1122 e & 12 Less: Preferred stock dividends Net income available to common stockholders Less: Common stock dividends Addition to retained earnings Per (common) share data: Earnings per share (EPS) Dividends per share (DPS) Book value per share (BVPS) Market value (price) per share (MVPS) $2.123 $1.000 $6.077 $14.750 $1.877 $1.000 $4.723 S12.550 Calculate the following ratios for Lake of Egypt Marina, Inc. as of year-end 2012. Industry Lake of Egypt Marina, Inc. (dollar amounts are in millions for parts a through u.) a. Current ratio b. Quick ratio c. Cash ratio d. Inventory turnover e. Days' sales in inventory f. Average collection period & Average payment period h. Fixed asset turnover 1. Sales to working capital J. Total asset turnover k. Capital intensity L Debt ratio m. Debt-to-equity n. Equity multiplier o. Times interest earned p. Cash coverage 4. Profit margin . Basic earnings power S. ROA L ROE u. Dividend payout v. Market-to-book ratio w. PE ratio 2.00 times 1.20 times 0.25 times 3.60 times 101.39 days 32.50 days 45.00 days 1.25 times 4.25 times 0.85 times 1.18 times 62.50% 1.67 times 2.67 times 8.50 times 8.75 times 28.75% 32.50% 19.75% 36.88% 35.00% 2.55 times 15.60 times
Step by Step Solution
There are 3 Steps involved in it

Get step-by-step solutions from verified subject matter experts