

Question: could you please explain how you would go about answering question 4 with the following information given? 1. What do the liquidity ratios--Current, Quick, and
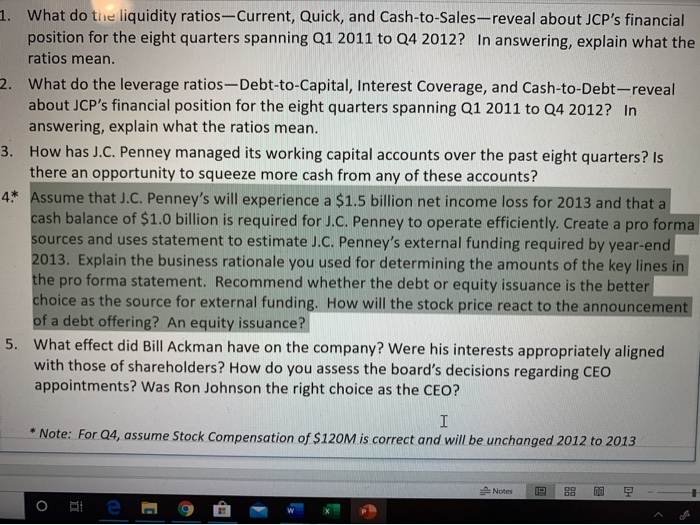
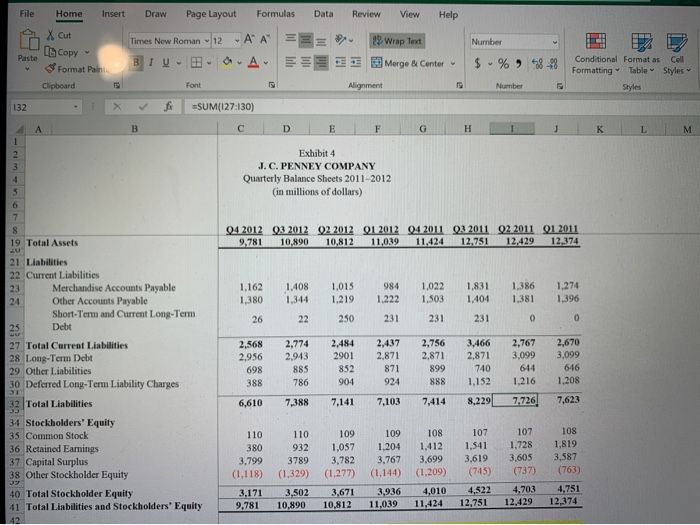
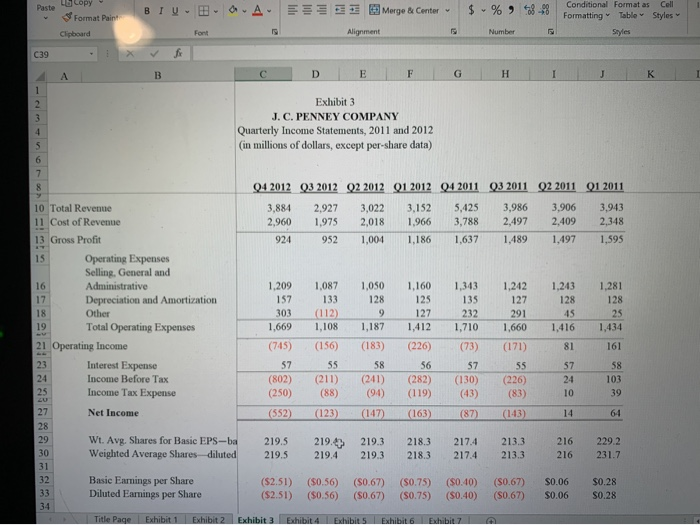
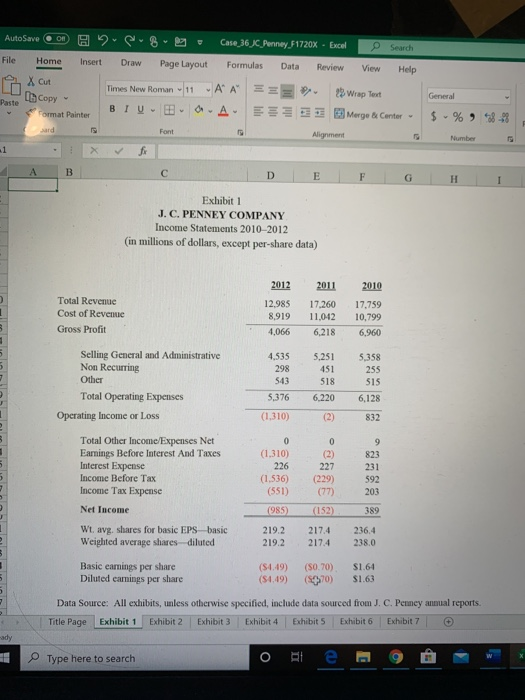
1. What do the liquidity ratios--Current, Quick, and Cash-to-Sales-reveal about JCP's financial position for the eight quarters spanning Q1 2011 to Q4 2012? In answering, explain what the ratios mean. What do the leverage ratios-Debt-to-Capital, Interest Coverage, and Cash-to-Debt-reveal about JCP's financial position for the eight quarters spanning Q1 2011 to Q4 2012? In answering, explain what the ratios mean. 3. How has J.C. Penney managed its working capital accounts over the past eight quarters? Is there an opportunity to squeeze more cash from any of these accounts? 4* Assume that J.C. Penney's will experience a $1.5 billion net income loss for 2013 and that a cash balance of $1.0 billion is required for J.C. Penney to operate efficiently. Create a pro forma sources and uses statement to estimate J.C. Penney's external funding required by year-end 2013. Explain the business rationale you used for determining the amounts of the key lines in the pro forma statement. Recommend whether the debt or equity issuance is the better choice as the source for external funding. How will the stock price react to the announcement of a debt offering? An equity issuance? What effect did Bill Ackman have on the company? Were his interests appropriately aligned with those of shareholders? How do you assess the board's decisions regarding CEO appointments? Was Ron Johnson the right choice as the CEO? * Note: For Q4, assume Stock Compensation of $120M is correct and will be unchanged 2012 to 2013 File Review View Help 2 Wrap Text Merge & Center - Paste Copy Home Insert Draw Page Layout Formulas Data Xcut Times New Roman - 12 - AA === Format Paint BIU. .A. E Clipboard Font - fr =SUM(127:130) C D E Number $ -% Number 48-48 Conditional Format as Formatting Table styles Cell Styles Alignment 132 F G H I J K Exhibit 4 J. C. PENNEY COMPANY Quarterly Balance Sheets 2011-2012 (in millions of dollars) 04 2012 03 2012 02 2012 01 2012 04 2011032011 Q2 2011 Q1 2011 9,781 10,890 10,812 11,039 11,424 12.751 12.429 12,374 23 1.162 1,380 26 1.408 1,344 22 1,015 1.219 250 984 1.222 231 1,022 1,503 231 1,831 1.404 231 1,386 1.381 0 1.274 1,396 0 2,756 2,871 19 Total Assets 21 Liabilities 22 Current Liabilities Merchandise Accounts Payable 24 Other Accounts Payable Short-Term and Current Long-Term Debt 27 Total Current Liabilities 28 Long-Term Debt 29 Other Liabilities 30 Deferred Long-Term Liability Charges 32 Total Liabilities 34 Stockholders' Equity 35 Common Stock 36 Retained Earnings 37 Capital Surplus 38 Other Stockholder Equity 40 Total Stockholder Equity 41 Total Liabilities and Stockholders' Equity 2,568 2.956 698 388 2,7742,484 2,437 2.943 2901 2.871 885 852 871 904 924 7,3887,1417,103 899 3,466 2.871 740 1,152 8,229 2,767 3.099 644 1,216 7,726 2,670 3.099 646 1.208 7,623 786 888 6,610 7,414 110 380 3.799 (1,118) 3,171 9,781 110 932 3789 (1,329) 3,502 10,890 109 1,057 3,782 (1.277) 3,671 10.812 109 108 1.2041,412 3.767 3,699 (1.144) (1.209) 3,936 4,010 11,039 11,424 107 1,541 3,619 (745) 4,522 12.751 107 1.728 3.605 (737) 4,703 12.429 108 1,819 3,587 (763) 4.751 12,374 Paste BIVA ES E Merge & Center - $ -% 18-28 Copy Format Paint Clipboard Conditional Format as Cell Formatting Table Styles Styles Font Alignment C D E F G H I J K Exhibit 3 J. C. PENNEY COMPANY Quarterly Income Statements, 2011 and 2012 (in millions of dollars, except per-share data) Q4 2012 03 2012 02 2012 Q1 2012 04 2011 Q3 2011 02 2011 01 2011 3,884 2,927 3,022 3,152 5,425 3,986 3,906 3,943 2,960 1975 2,018 1,966 3,788 2,497 2,409 2,348 924 952 1,004 1,186 1,637 1,489 1,497 1,595 1.209 1,050 1,160 1,343 1.242 1,243 10 Total Revenue 11 Cost of Revenue 13 Gross Profit Operating Expenses Selling. General and Administrative Depreciation and Amortization Other Total Operating Expenses 21 Operating Income Interest Expense Income Before Tax Income Tax Expense 1,281 128 157 135 1,087 133 (112) 1.108 128 303 1.669 303 (112) 1,412 1.187 1,710 1,660 1.416 1,434 (745) (156) (156 (226 (73) (171) 161 52 55 56 57 (802) (250) (552) (211) (88) (123) (241) (94) (147) (282) (119) (163) (130) (43) (87) (226) (83) Net Income (143) 14 Wt. Avg. Shares for Basic EPS-ba Weighted Average Shares diluted 219.5 219.5 219.4) 219.4 219.3 219.3 218.3 218.3 217.4 217.4 213.3 213.3 216 216 229.2 231.7 Basic Earnings per Share Diluted Earnings per Share ($2.51) (52.51) ($0.56) (50.56) ($0.67) ($0.67) (S0.75) (S0.75) ($0.40) ($0.40) ($0.67) (30.67) $0.06 0.06 $0.28 0.28 Title Page Exhibit 1 Exhibit 2 Exhibit 3 Exhibit 4 Exhibits Exhibit 6 Exhibit 7 AutoSave 2 B9 Ce, 36JC Penney F1720x - Excel Sewch File Home Insert Draw Page Layout Formulas Data Review View Help Xcut Times New Roman - 11 AA = Wrap Test BIU-B Format Painter AA EEE 3Merge & Center - sard Alignment Paste General $ - %) *8-23 Number 4 D E F G H I Exhibit 1 J. C. PENNEY COMPANY Income Statements 2010-2012 (in millions of dollars, except per-share data) Total Revenue Cost of Reveme Gross Profit 2012 12,985 8,919 4,066 2011 17.260 11.042 6,218 2010 17,759 10,799 6,960 Selling General and Administrative Non Recurring Other Total Operating Expenses 4,535 298 543 5.376 5,251 451 518 5.358 255 SIS 6,128 6,220 (2) Operating Income or Loss (1,310) 832 0 9 823 Total Other Income Expenses Net Earnings Before Interest And Taxes Interest Expense Income Before Tax Income Tax Expense 227 (1.310) 226 (1.536) (551) (229) 231 592 203 Net Income (985) (152) 389 Wt. avg. shares for basic EPS-basic Weighted average shares diluted 219.2 219.2 217.4 217.4 236.4 238.0 Basic earnings per share Diluted earnings per share (94.19) (54.49) (S0.70) (S570) $1.64 $1.63 Data Source: All exhibits, unless otherwise specified, include data sourced from J. C. Penney annual reports Title Page Exhibit 1 Exhibit 2 Exhibit 3 Exhibit 4 Exhibits Exhibit 6 Exhibit 7 ady Type here to search Ofte 9 1. What do the liquidity ratios--Current, Quick, and Cash-to-Sales-reveal about JCP's financial position for the eight quarters spanning Q1 2011 to Q4 2012? In answering, explain what the ratios mean. What do the leverage ratios-Debt-to-Capital, Interest Coverage, and Cash-to-Debt-reveal about JCP's financial position for the eight quarters spanning Q1 2011 to Q4 2012? In answering, explain what the ratios mean. 3. How has J.C. Penney managed its working capital accounts over the past eight quarters? Is there an opportunity to squeeze more cash from any of these accounts? 4* Assume that J.C. Penney's will experience a $1.5 billion net income loss for 2013 and that a cash balance of $1.0 billion is required for J.C. Penney to operate efficiently. Create a pro forma sources and uses statement to estimate J.C. Penney's external funding required by year-end 2013. Explain the business rationale you used for determining the amounts of the key lines in the pro forma statement. Recommend whether the debt or equity issuance is the better choice as the source for external funding. How will the stock price react to the announcement of a debt offering? An equity issuance? What effect did Bill Ackman have on the company? Were his interests appropriately aligned with those of shareholders? How do you assess the board's decisions regarding CEO appointments? Was Ron Johnson the right choice as the CEO? * Note: For Q4, assume Stock Compensation of $120M is correct and will be unchanged 2012 to 2013 File Review View Help 2 Wrap Text Merge & Center - Paste Copy Home Insert Draw Page Layout Formulas Data Xcut Times New Roman - 12 - AA === Format Paint BIU. .A. E Clipboard Font - fr =SUM(127:130) C D E Number $ -% Number 48-48 Conditional Format as Formatting Table styles Cell Styles Alignment 132 F G H I J K Exhibit 4 J. C. PENNEY COMPANY Quarterly Balance Sheets 2011-2012 (in millions of dollars) 04 2012 03 2012 02 2012 01 2012 04 2011032011 Q2 2011 Q1 2011 9,781 10,890 10,812 11,039 11,424 12.751 12.429 12,374 23 1.162 1,380 26 1.408 1,344 22 1,015 1.219 250 984 1.222 231 1,022 1,503 231 1,831 1.404 231 1,386 1.381 0 1.274 1,396 0 2,756 2,871 19 Total Assets 21 Liabilities 22 Current Liabilities Merchandise Accounts Payable 24 Other Accounts Payable Short-Term and Current Long-Term Debt 27 Total Current Liabilities 28 Long-Term Debt 29 Other Liabilities 30 Deferred Long-Term Liability Charges 32 Total Liabilities 34 Stockholders' Equity 35 Common Stock 36 Retained Earnings 37 Capital Surplus 38 Other Stockholder Equity 40 Total Stockholder Equity 41 Total Liabilities and Stockholders' Equity 2,568 2.956 698 388 2,7742,484 2,437 2.943 2901 2.871 885 852 871 904 924 7,3887,1417,103 899 3,466 2.871 740 1,152 8,229 2,767 3.099 644 1,216 7,726 2,670 3.099 646 1.208 7,623 786 888 6,610 7,414 110 380 3.799 (1,118) 3,171 9,781 110 932 3789 (1,329) 3,502 10,890 109 1,057 3,782 (1.277) 3,671 10.812 109 108 1.2041,412 3.767 3,699 (1.144) (1.209) 3,936 4,010 11,039 11,424 107 1,541 3,619 (745) 4,522 12.751 107 1.728 3.605 (737) 4,703 12.429 108 1,819 3,587 (763) 4.751 12,374 Paste BIVA ES E Merge & Center - $ -% 18-28 Copy Format Paint Clipboard Conditional Format as Cell Formatting Table Styles Styles Font Alignment C D E F G H I J K Exhibit 3 J. C. PENNEY COMPANY Quarterly Income Statements, 2011 and 2012 (in millions of dollars, except per-share data) Q4 2012 03 2012 02 2012 Q1 2012 04 2011 Q3 2011 02 2011 01 2011 3,884 2,927 3,022 3,152 5,425 3,986 3,906 3,943 2,960 1975 2,018 1,966 3,788 2,497 2,409 2,348 924 952 1,004 1,186 1,637 1,489 1,497 1,595 1.209 1,050 1,160 1,343 1.242 1,243 10 Total Revenue 11 Cost of Revenue 13 Gross Profit Operating Expenses Selling. General and Administrative Depreciation and Amortization Other Total Operating Expenses 21 Operating Income Interest Expense Income Before Tax Income Tax Expense 1,281 128 157 135 1,087 133 (112) 1.108 128 303 1.669 303 (112) 1,412 1.187 1,710 1,660 1.416 1,434 (745) (156) (156 (226 (73) (171) 161 52 55 56 57 (802) (250) (552) (211) (88) (123) (241) (94) (147) (282) (119) (163) (130) (43) (87) (226) (83) Net Income (143) 14 Wt. Avg. Shares for Basic EPS-ba Weighted Average Shares diluted 219.5 219.5 219.4) 219.4 219.3 219.3 218.3 218.3 217.4 217.4 213.3 213.3 216 216 229.2 231.7 Basic Earnings per Share Diluted Earnings per Share ($2.51) (52.51) ($0.56) (50.56) ($0.67) ($0.67) (S0.75) (S0.75) ($0.40) ($0.40) ($0.67) (30.67) $0.06 0.06 $0.28 0.28 Title Page Exhibit 1 Exhibit 2 Exhibit 3 Exhibit 4 Exhibits Exhibit 6 Exhibit 7 AutoSave 2 B9 Ce, 36JC Penney F1720x - Excel Sewch File Home Insert Draw Page Layout Formulas Data Review View Help Xcut Times New Roman - 11 AA = Wrap Test BIU-B Format Painter AA EEE 3Merge & Center - sard Alignment Paste General $ - %) *8-23 Number 4 D E F G H I Exhibit 1 J. C. PENNEY COMPANY Income Statements 2010-2012 (in millions of dollars, except per-share data) Total Revenue Cost of Reveme Gross Profit 2012 12,985 8,919 4,066 2011 17.260 11.042 6,218 2010 17,759 10,799 6,960 Selling General and Administrative Non Recurring Other Total Operating Expenses 4,535 298 543 5.376 5,251 451 518 5.358 255 SIS 6,128 6,220 (2) Operating Income or Loss (1,310) 832 0 9 823 Total Other Income Expenses Net Earnings Before Interest And Taxes Interest Expense Income Before Tax Income Tax Expense 227 (1.310) 226 (1.536) (551) (229) 231 592 203 Net Income (985) (152) 389 Wt. avg. shares for basic EPS-basic Weighted average shares diluted 219.2 219.2 217.4 217.4 236.4 238.0 Basic earnings per share Diluted earnings per share (94.19) (54.49) (S0.70) (S570) $1.64 $1.63 Data Source: All exhibits, unless otherwise specified, include data sourced from J. C. Penney annual reports Title Page Exhibit 1 Exhibit 2 Exhibit 3 Exhibit 4 Exhibits Exhibit 6 Exhibit 7 ady Type here to search Ofte 9
Step by Step Solution
There are 3 Steps involved in it

Get step-by-step solutions from verified subject matter experts