

Question: Could you please explain the exercise1.3 ? Exercise 1.2 In the table below are listed a series of points that dene an economy's production possibility
Could you please explain the exercise1.3 ?
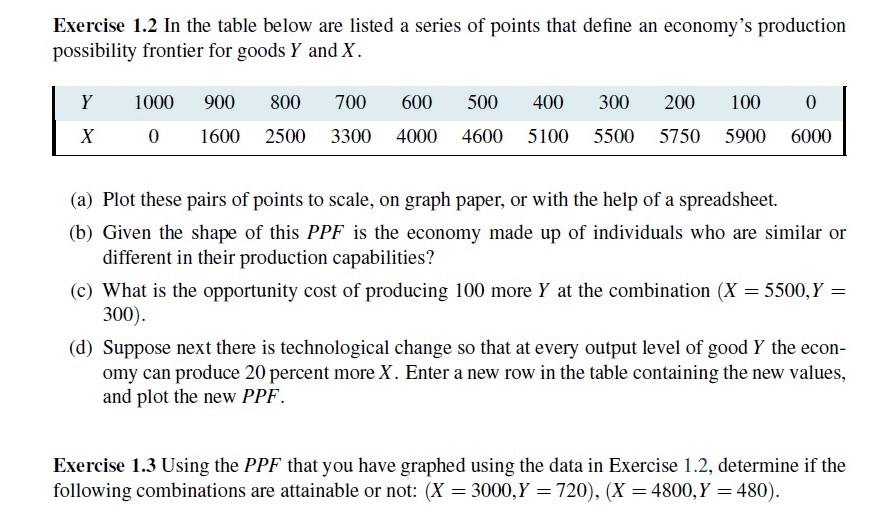
Exercise 1.2 In the table below are listed a series of points that dene an economy's production possibility frontier for goods 1\" and X. 1' 1000 900 800 700 600 500 400 300 200 100 0 X 0 1600 2500 3300 4000 4600 5100 5500 53150 5900 6000 (a) Plot these pairs of points to scale, on graph paper, or with the help of a spreadsheet. (b) Given the shape of this PPF is the economy made up of individuals who are similar or different in their production capabilities? (c) What is the opportunity cost of producing 100 more 1' at the combination (X : 5500,Y : 300). (d) Suppose next there is technological change so that at every output level of good 1' the econ- omy can produce 20 percent moreX . Enter a new row in the table containing the new values, and plot the new PPF. Exercise 1.3 Using the PPF that you have graphed using the data in Exercise 1.2, determine if the following combinations are attainable or not: (X : 3000,1' : 720), {X = 4800, Y = 480)
Step by Step Solution
There are 3 Steps involved in it

Get step-by-step solutions from verified subject matter experts