

Question: Could you please go step by step getting the answer Given the following table answer questions 7-9. Carry four decimals. Period Actual Forecast 1 Forecast
Could you please go step by step getting the answer
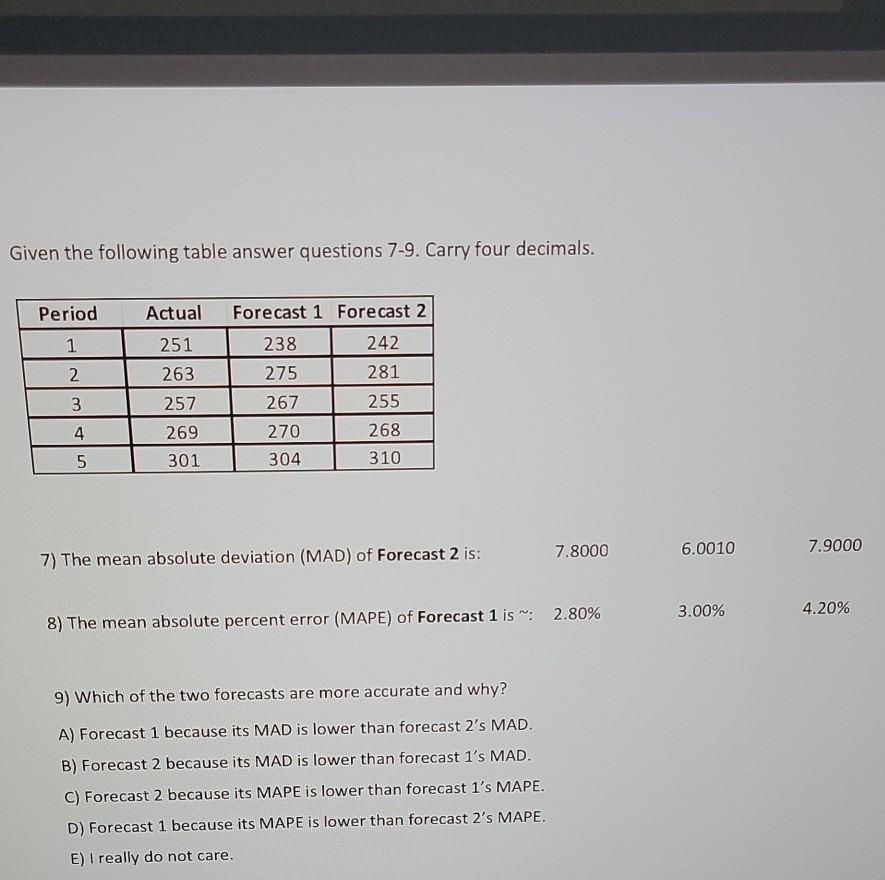
Given the following table answer questions 7-9. Carry four decimals. Period Actual Forecast 1 Forecast 2 1 251 238 242 2 263 275 281 3 257 267 255 4 269 270 268 5 301 304 310 7.8000 6.0010 7.9000 7) The mean absolute deviation (MAD) of Forecast 2 is: 3.00% 4.20% 8) The mean absolute percent error (MAPE) of Forecast 1 is 2.80% 9) Which of the two forecasts are more accurate and why? A) Forecast 1 because its MAD is lower than forecast 2's MAD. B) Forecast 2 because its MAD is lower than forecast 1's MAD. C) Forecast 2 because its MAPE is lower than forecast 1's MAPE. D) Forecast 1 because its MAPE is lower than forecast 2's MAPE. E) I really do not careStep by Step Solution
There are 3 Steps involved in it
1 Expert Approved Answer
Step: 1 Unlock

Question Has Been Solved by an Expert!
Get step-by-step solutions from verified subject matter experts
Step: 2 Unlock
Step: 3 Unlock