

Question: Could you please help me with question 2? I know how to do question but have no idea of question 2 The graph below shows
Could you please help me with question 2? I know how to do question but have no idea of question 2
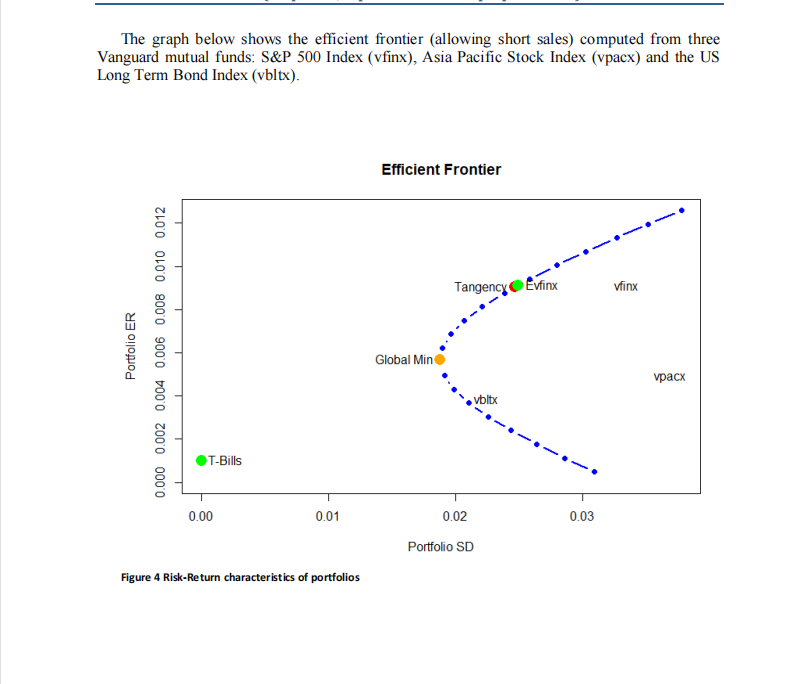
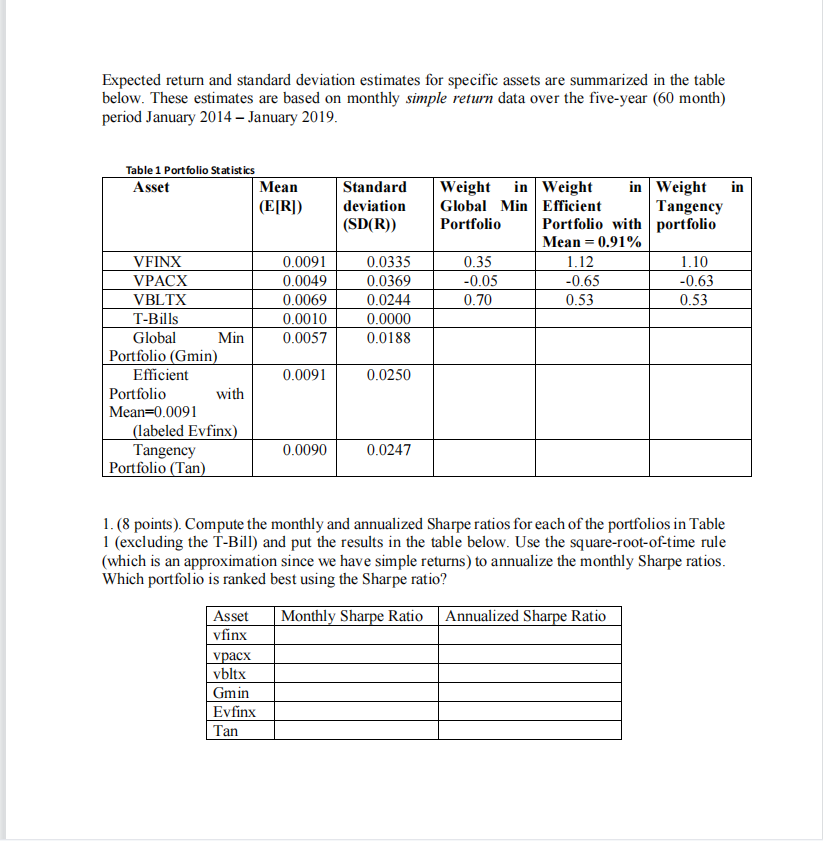
The graph below shows the efficient frontier (allowing short sales) computed from three Vanguard mutual funds: S\&P 500 Index (vfinx), Asia Pacific Stock Index (vpacx) and the US Long Term Bond Index (vbltx). Figure 4 Risk-Return characteristics of portfolios The graph below shows the efficient frontier (allowing short sales) computed from three Vanguard mutual funds: S\&P 500 Index (vfinx), Asia Pacific Stock Index (vpacx) and the US Long Term Bond Index (vbltx). Figure 4 Risk-Return characteristics of portfolios Expected return and standard deviation estimates for specific assets are summarized in the table below. These estimates are based on monthly simple return data over the five-year ( 60 month) period January 2014 - January 2019. 1. (8 points). Compute the monthly and annualized Sharpe ratios for each of the portfolios in Table 1 (excluding the T-Bill) and put the results in the table below. Use the square-root-of-time rule (which is an approximation since we have simple returns) to annualize the monthly Sharpe ratios. Which portfolio is ranked best using the Sharpe ratio? 2. The Sharpe ratios you computed in part 1 above are estimates. Write down the 95% two-sided confidence interval for these estimated Sharpe ratios by using bootstraps. Briefly explain your results
Step by Step Solution
There are 3 Steps involved in it

Get step-by-step solutions from verified subject matter experts