

Question: Could you please help me with this assignment and give thorough explanations? Thank you! 1. The data below shows the price and quantity information for
Could you please help me with this assignment and give thorough explanations? Thank you!
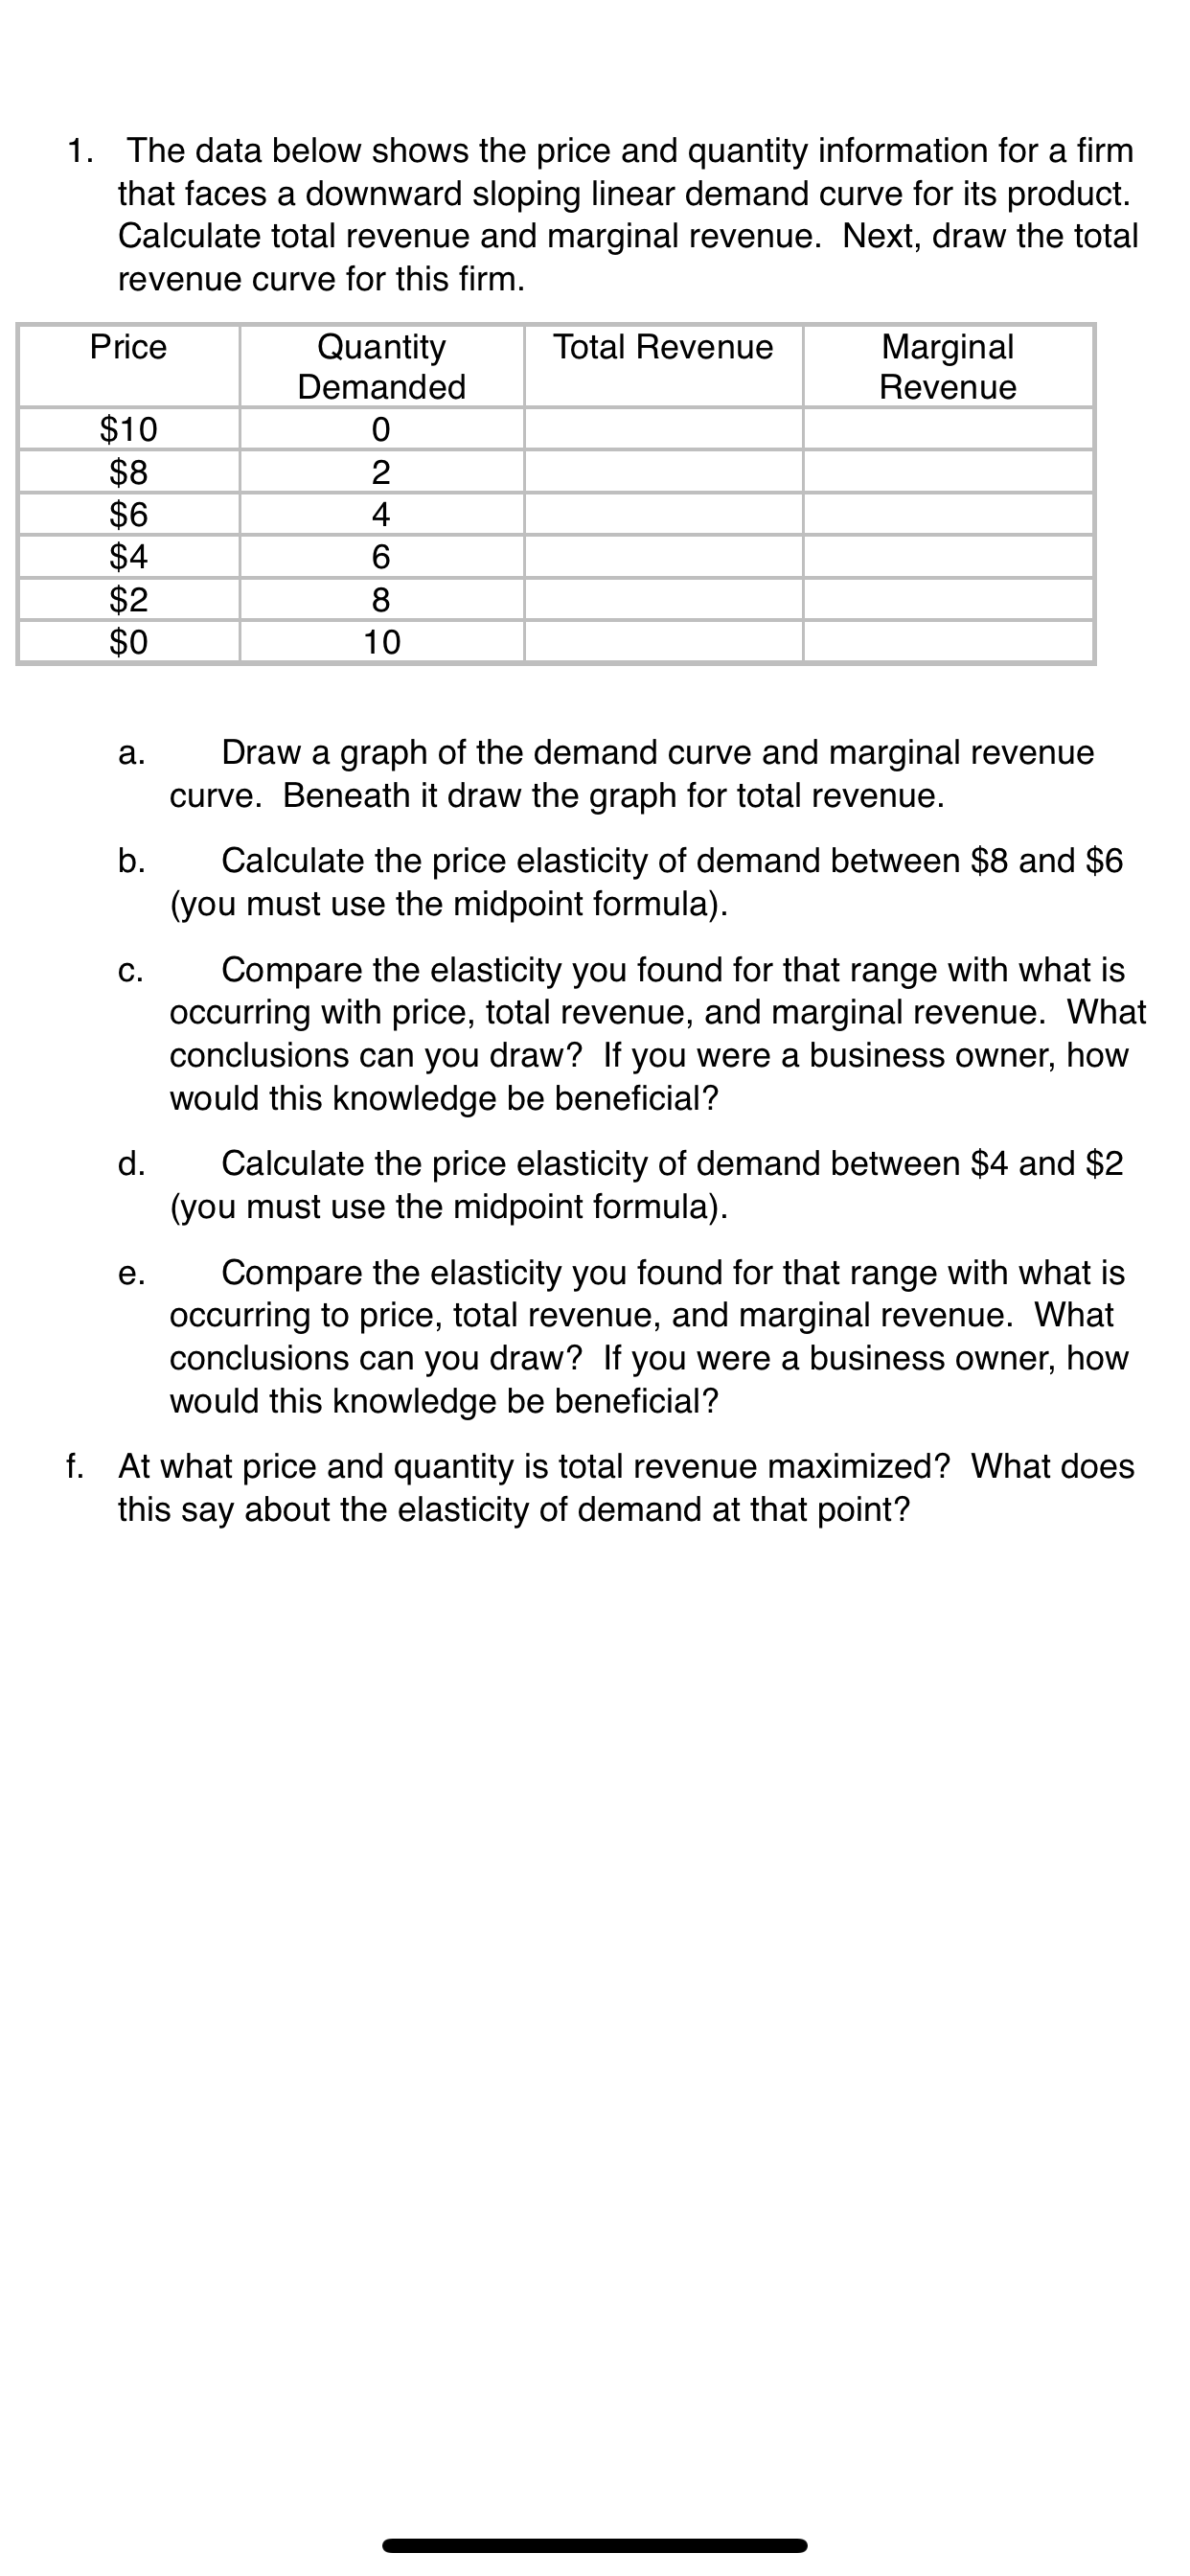
1. The data below shows the price and quantity information for a firm that faces a downward sloping linear demand curve for its product. Calculate total revenue and marginal revenue. Next, draw the total revenue curve for this firm. Demanded Revenue . \" - -_ \" a. Draw a graph of the demand curve and marginal revenue curve. Beneath it draw the graph for total revenue. Calculate the price elasticity of demand between $8 and $6 (you must use the midpoint formula). Compare the elasticity you found for that range with what is occurring with price, total revenue, and marginal revenue. What conclusions can you draw? If you were a business owner, how would this knowledge be beneficial? Calculate the price elasticity of demand between $4 and $2 (you must use the midpoint formula). Compare the elasticity you found for that range with what is occurring to price, total revenue, and marginal revenue. What conclusions can you draw? If you were a business owner, how would this knowledge be beneficial? f. At what price and quantity is total revenue maximized? What does this say about the elasticity of demand at that point
Step by Step Solution
There are 3 Steps involved in it

Get step-by-step solutions from verified subject matter experts