

Question: Could you please help us to interpret Table 4.11 Regression Analysis & Table 4.12 ANOVA thoroughly? What is the main interpretation of stepwise analysis table
- Could you please help us to interpret Table 4.11 Regression Analysis & Table 4.12 ANOVA thoroughly?
- What is the main interpretation of stepwise analysis table (Model 1 & Model 2) and how it was related to hypotheses result?
- What is the overall meaning of Hypotheses result?
I don't know what does it mean. Please give an explaination as well.
Topic: Factor affecting the demand of Thai Boat Noodles
Model 1: Demographic
Model 2: Demographic + Service Marketing Mix
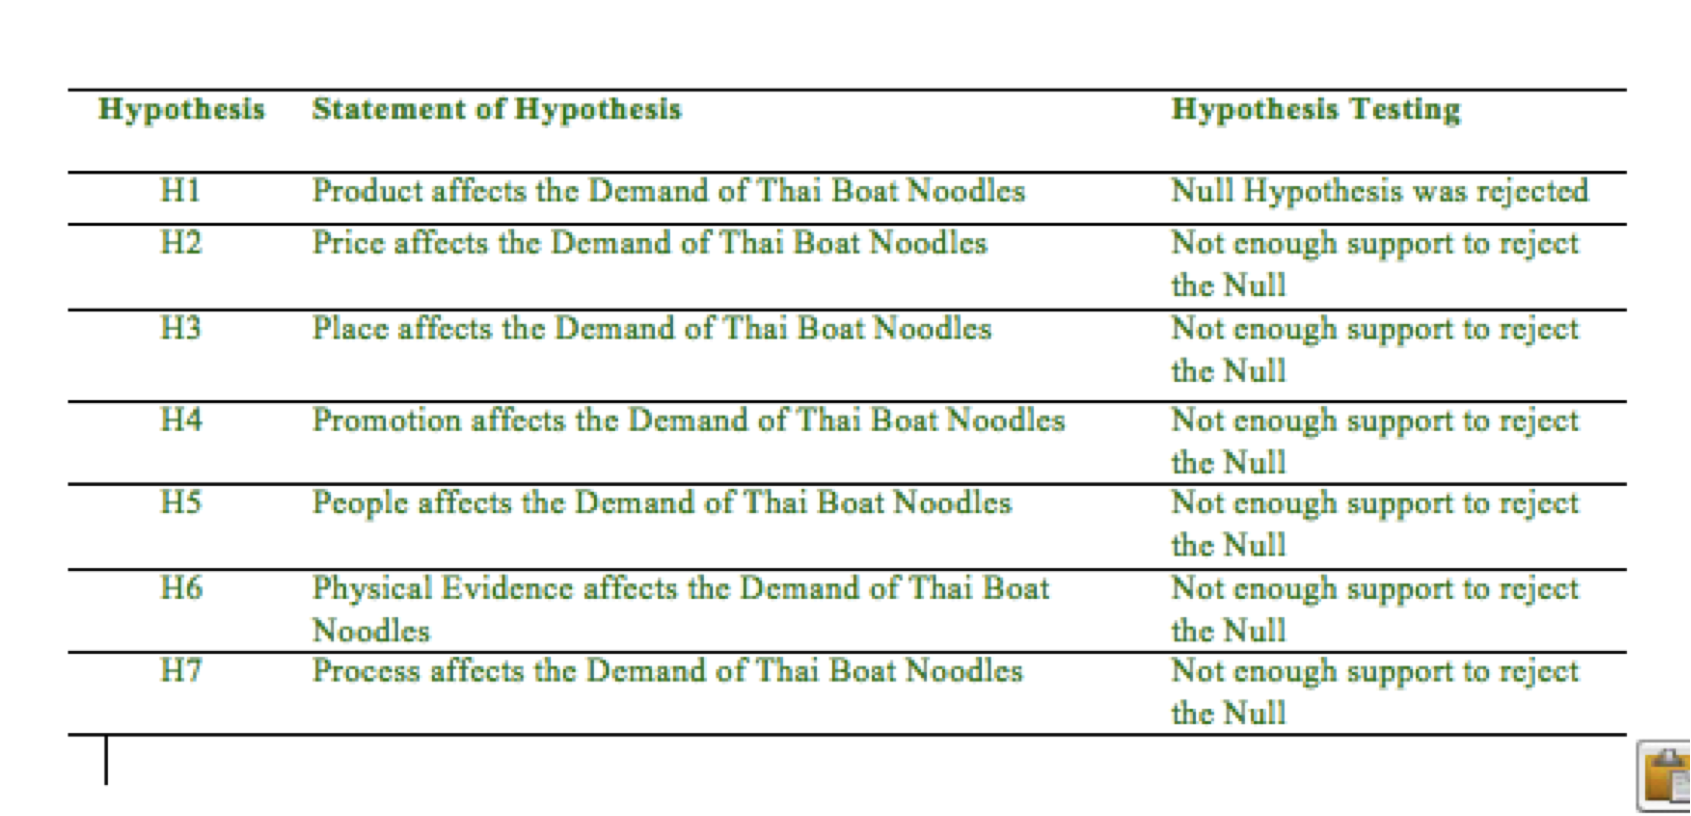
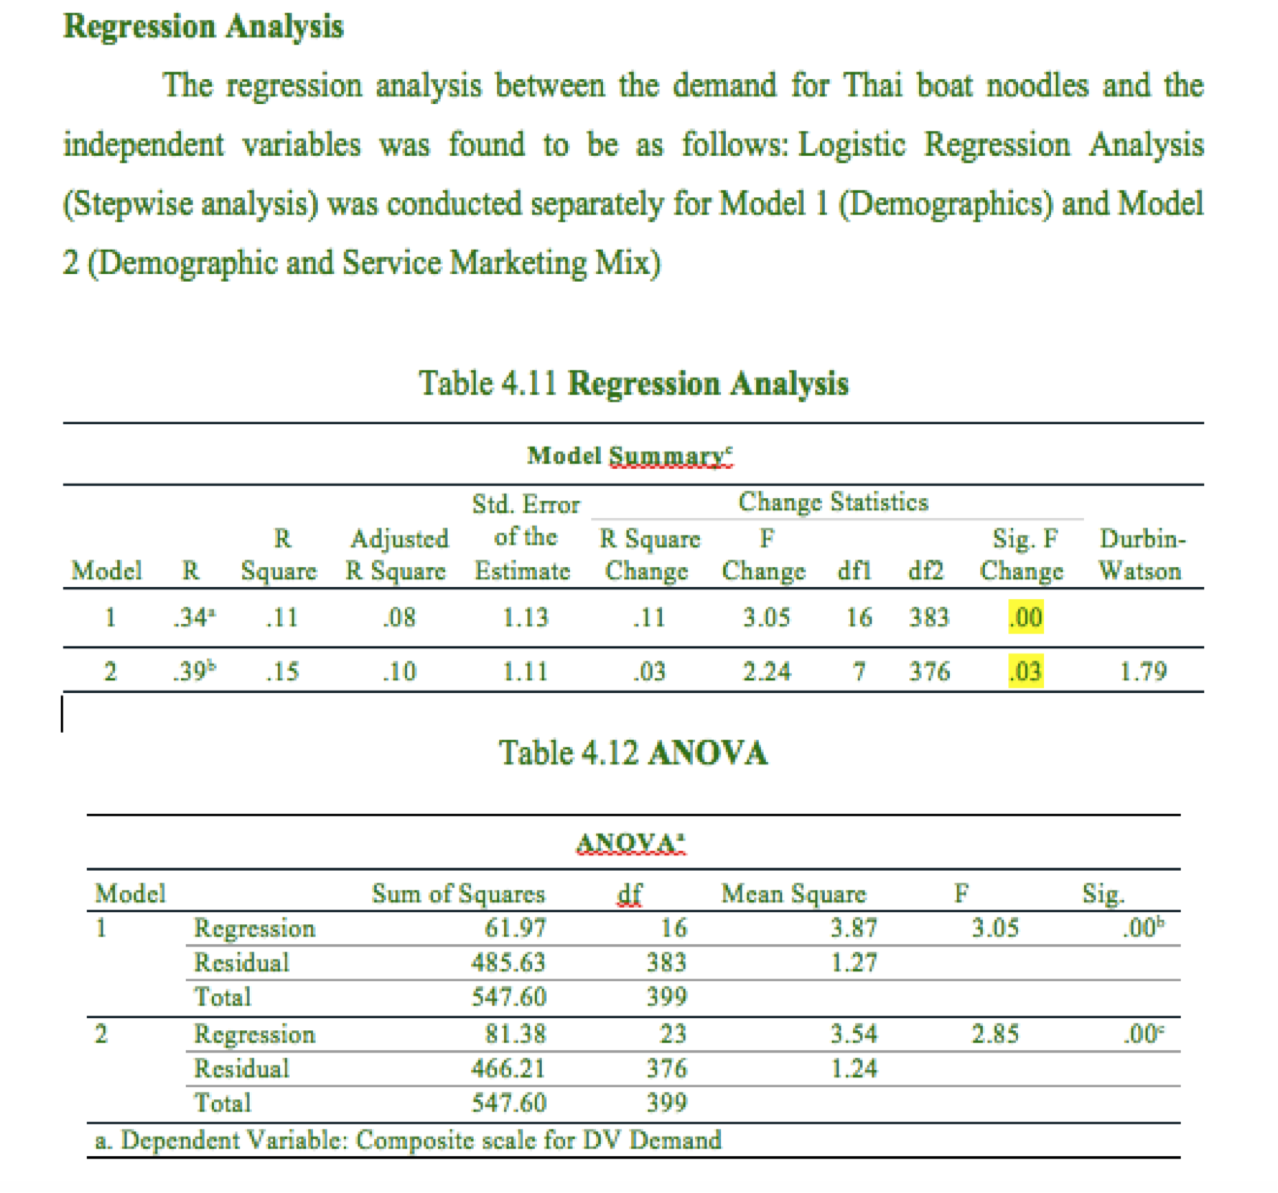
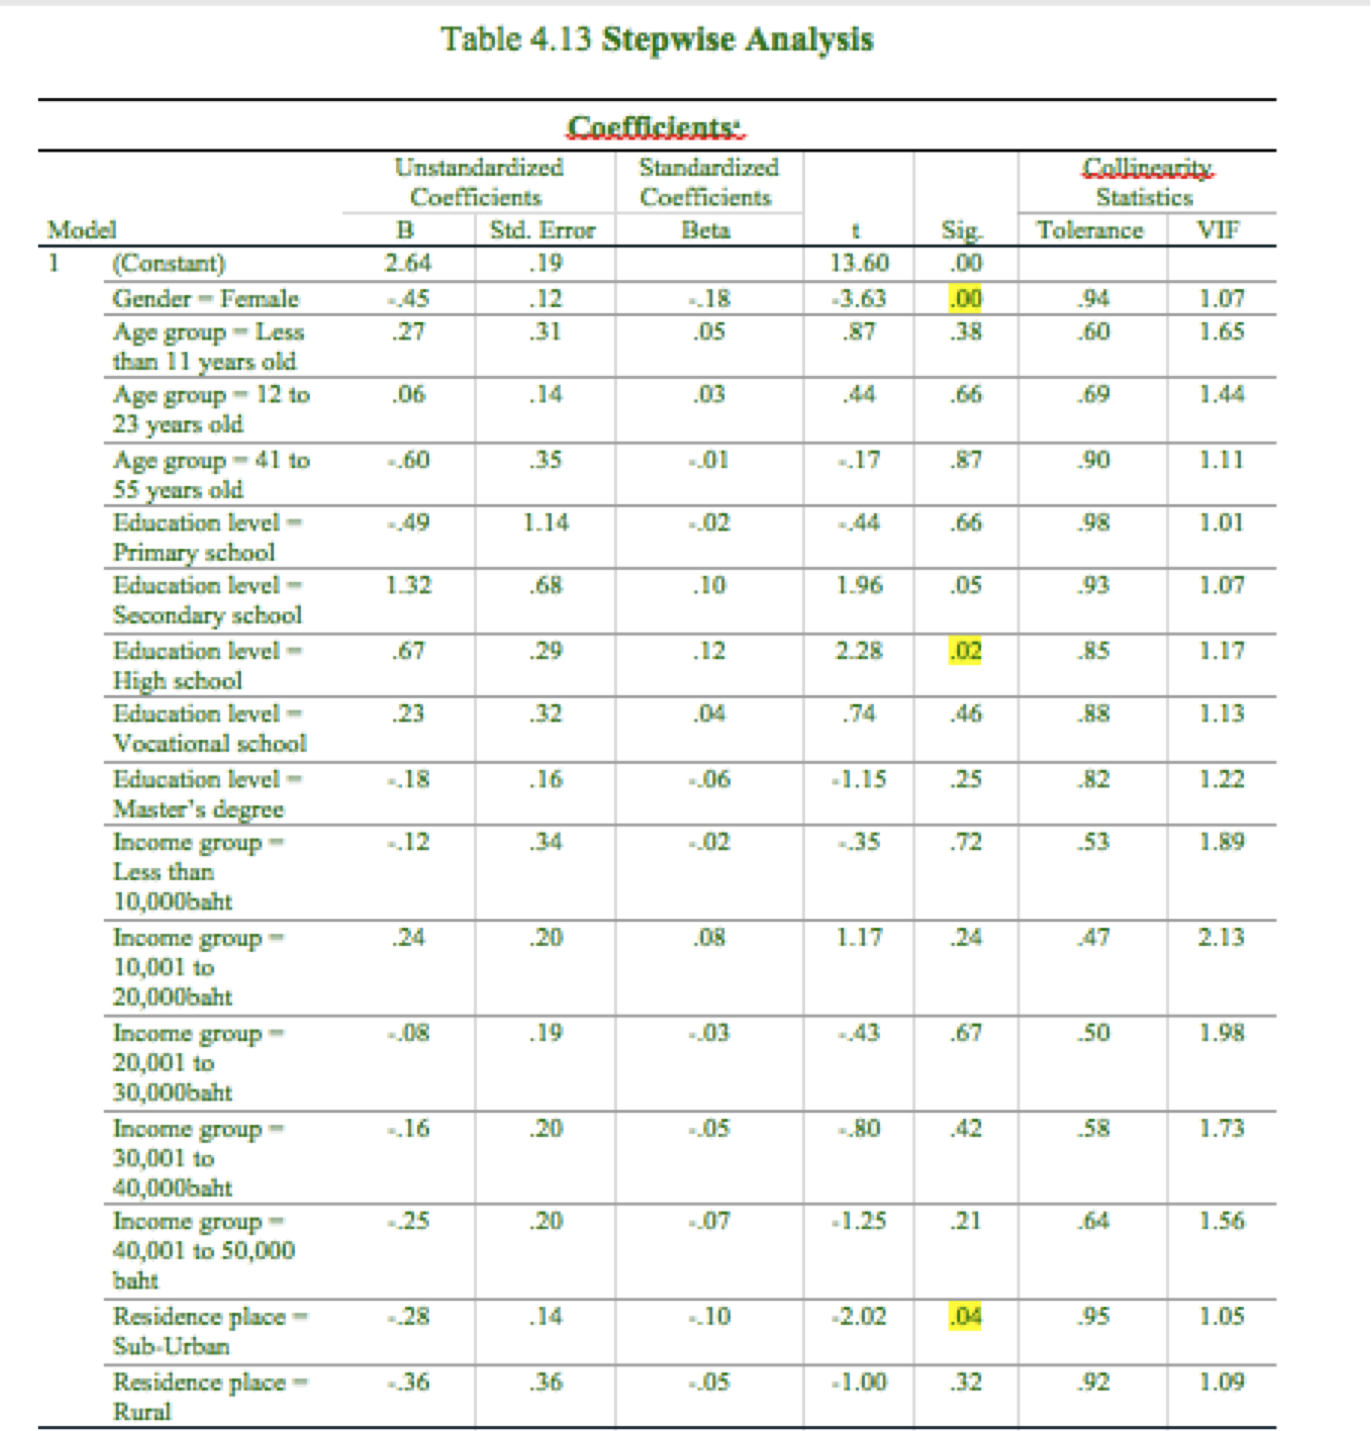
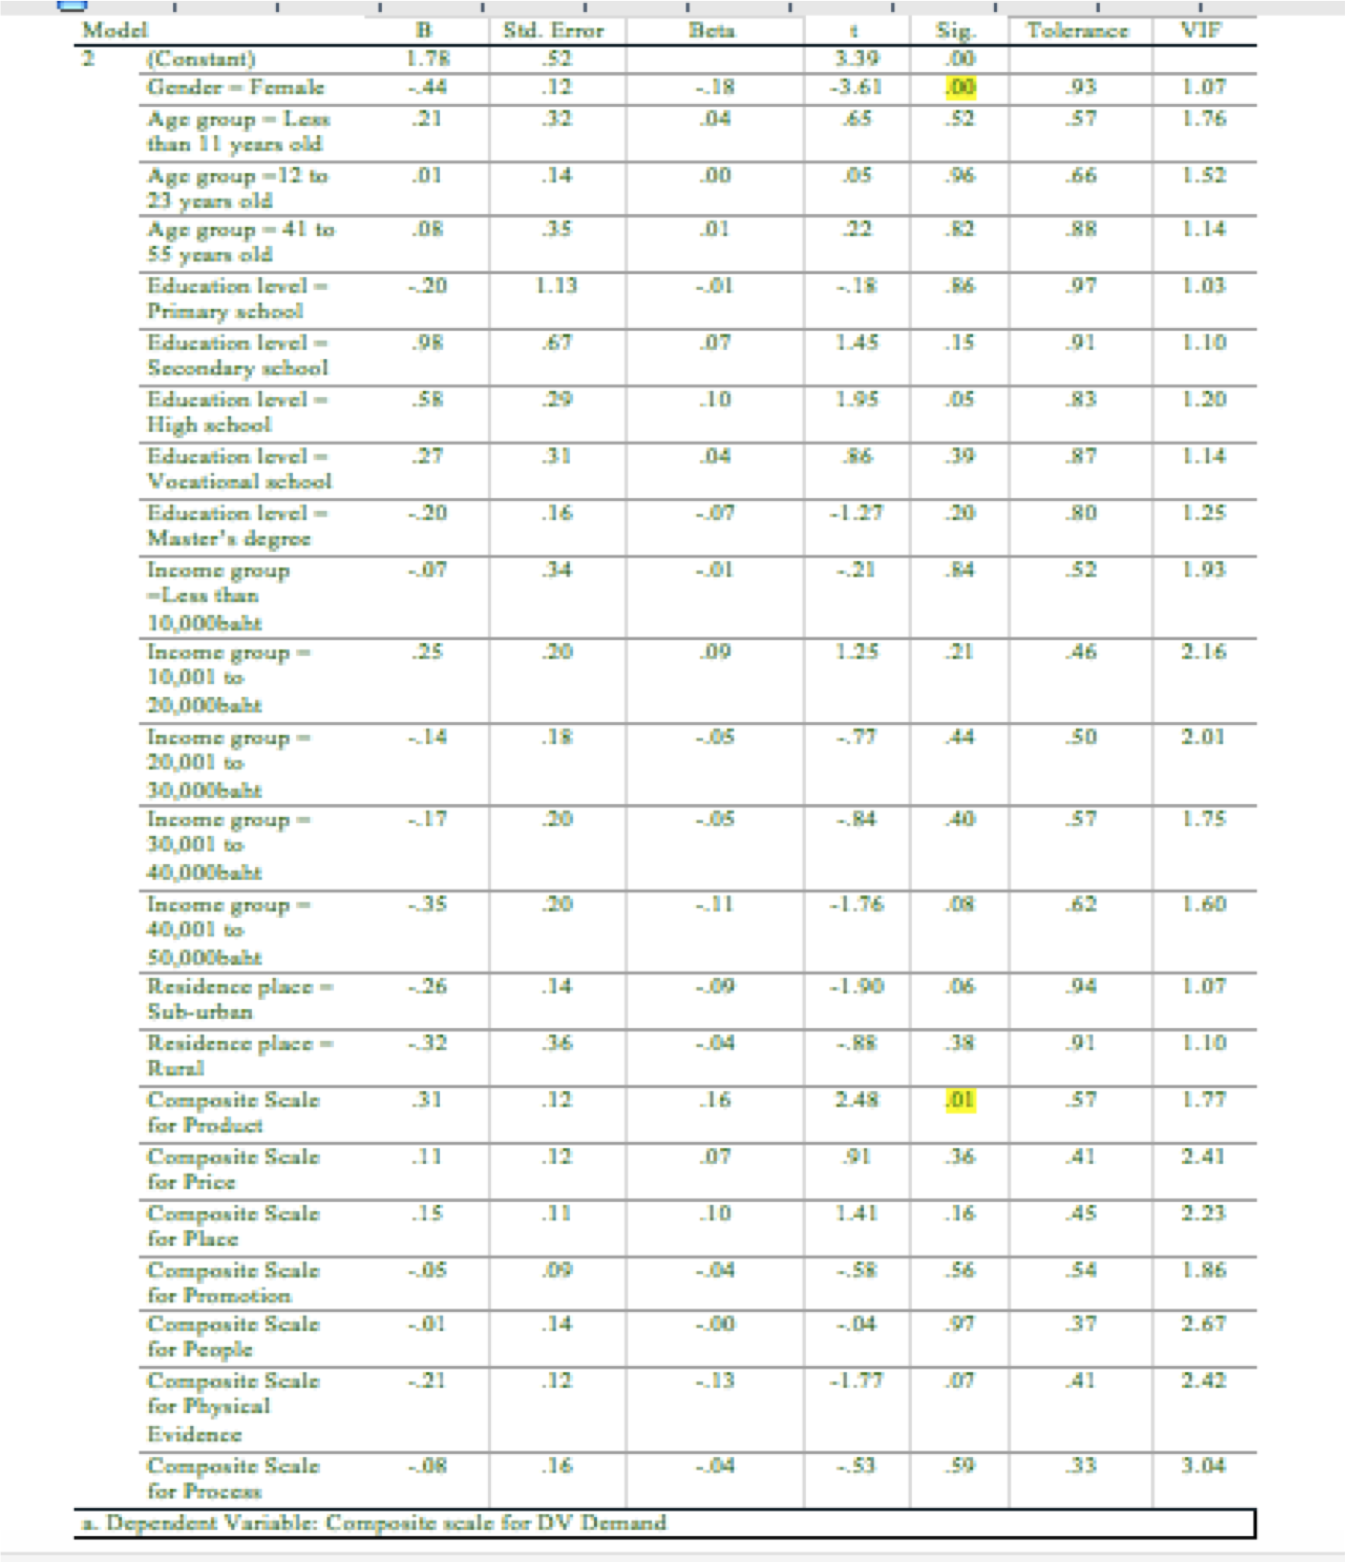
Hypothesis Statement of Hypothesis Hyperlink Testing H1 Product affects the Demand of Thai Boat Noodles Null Hypothesis was rejected H2 Price affects the Demand of Thai Boat Noodles Not enough support to reject the Null H3 Place affects the Demand of Thai Boat Noodles Not enough support In reject the Null H4 Promotion affects the Demand of Thai Boat Noodles Not enough support to reject the Null H5 People affects the Demand of Thai Boat Noodles Not enough support to reject the Null H6 Physical Evidence affects the Demand of Thai Boat Not enough support to reject Noodles the Null [-17 Process affects the Demand of Thai Boat Noodles Not enough support to reject the Null I E Regression Analysis The regression analysis between the demand for Thai boat noodles and the independent variables was found to be as follows: Logistic Regression Analysis (Stepwise analysis) was conducted separately for Model 1 (Demographics) and Model 2 (Demographic and Service Marketing Mix) Table 4.11 Regression Analysis Model Summary Std. Error Change Statistics R Adjusted of the R Square F Sig. F Durbin- Model R Square R Square Estimate Change Change dfl df2 Change Watson 1 .34 .11 08 1.13 .11 3.05 16 383 .00 2 .39 .15 10 1.11 03 2.24 7 376 .03 1.79 Table 4.12 ANOVA ANOVAL Model Sum of Squares df Mean Square F Sig. Regression 61.97 16 3.87 3.05 00b Residual 485.63 383 1.27 Total 547.60 399 2 Regression 81.38 23 3.54 2.85 00 Residual 466.21 376 1.24 Total 547.60 399 a. Dependent Variable: Composite scale for DV DemandTable 4.13 Stepwise Analysis Coefficients: Unstandardized Standardized Callingunity Model Coefficients B Coefficients Std. Error Beta Statistics (Constant) 2.64 Sig Tolerance VIF Gender - Female 19 -.45 13.60 .00 Age group - Less .12 .27 18 .31 .3.63 .00 .94 87 1.07 than 11 years old .05 38 .60 1.65 Age group - 12 to 06 23 years old .14 03 .44 .66 69 1.44 Age group - 41 to 55 years old -.60 35 101 -.17 87 90 1.11 Education level- .49 Primary school 1.14 _02 66 98 1.01 Education level - Secondary school 1.32 68 10 1.96 .05 93 1.07 Education level - High school 67 29 12 2.28 .02 85 1.17 Education level - Vocational school .23 .32 .04 .74 .46 88 1.13 Education level - Master's degree 4.18 .16 .06 -1.15 .25 .82 1.22 Income group Less than -.12 34 .02 .35 .72 53 1.89 10,000baht Income group = 24 10,001 to 20 1.17 24 47 2.13 20,000baht Income group- 20,001 to 19 -.43 67 50 1.98 30,000baht Income group 30,001 to 416 20 105 -.80 42 58 1.73 40,000baht Income group = 40,001 to 50,000 .25 20 407 -1.25 .21 64 1.56 baht Residence place = Sub-Urban -.28 .14 -.10 .2.02 .04 95 1.05 Residence place = Rural ..36 .36 -.05 -1.00 .32 92 1.09Model B Sod. Error (Constant) Gender - Female 1.78 Beta .52 Sig Tolerance VIF -44 3.30 Age group - Less .12 -3.61 than I1 years old .21 32 .04 -93 1.07 57 1.76 Age group - 12 to 23 years old .01 .14 .00 105 .66 1.52 Age group - 41 to 55 years old .OR .35 RR 1.14 Education level - -20 Primary school 1.13 -01 97 1.03 Education level- Secondary school .OR 67 07 1.45 15 91 1.10 Education level - High school -SR .29 10 1.95 83 1.20 Education level- Vocational school .27 .31 .04 87 1.14 Education level = Master's degree - 20 16 -07 -1.27 20 1.25 Income group - 07 -Less than .34 .21 R4 52 1.93 10.000babe Income group 10,001 to .25 20 00 1.25 .21 46 2.16 20 000bake Income group 20,001 to -14 -.77 4A 50 2.01 30 000bake Income group 17 30,001 to 20 .R4 40 57 1.75 40 000babe Income group 40,001 to -35 20 -1.76 .62 1.60 50 000bake Residence place = Sub-urban - 26 .14 -1.90 1.07 Residence place = Rural - 32 .36 38 1.10 Composite Scale for Product .31 .12 16 2.48 .DI 57 1.77 Composite Scale for Price .11 .12 07 36 41 2.41 Composite Scale for Place 15 -10 141 .16 45 2.23 Composite Scale for Promotion 56 54 1.86 Composite Scale for People -01 .14 -00 -.04 37 2.67 Composite Scale for Physical - 21 .12 --13 -1.77 41 2.42 Evidence Composite Scale OR for Process 16 -.$3 33 3.04 a. Dependent Variable: Composite scale for DV Demand
Step by Step Solution
There are 3 Steps involved in it

Get step-by-step solutions from verified subject matter experts