

Question: could you please help with this question? how do I infer this precisely from scatterplot? Safari File Edit View History Bookmarks Window Help ONEXT )
could you please help with this question? how do I infer this precisely from scatterplot?
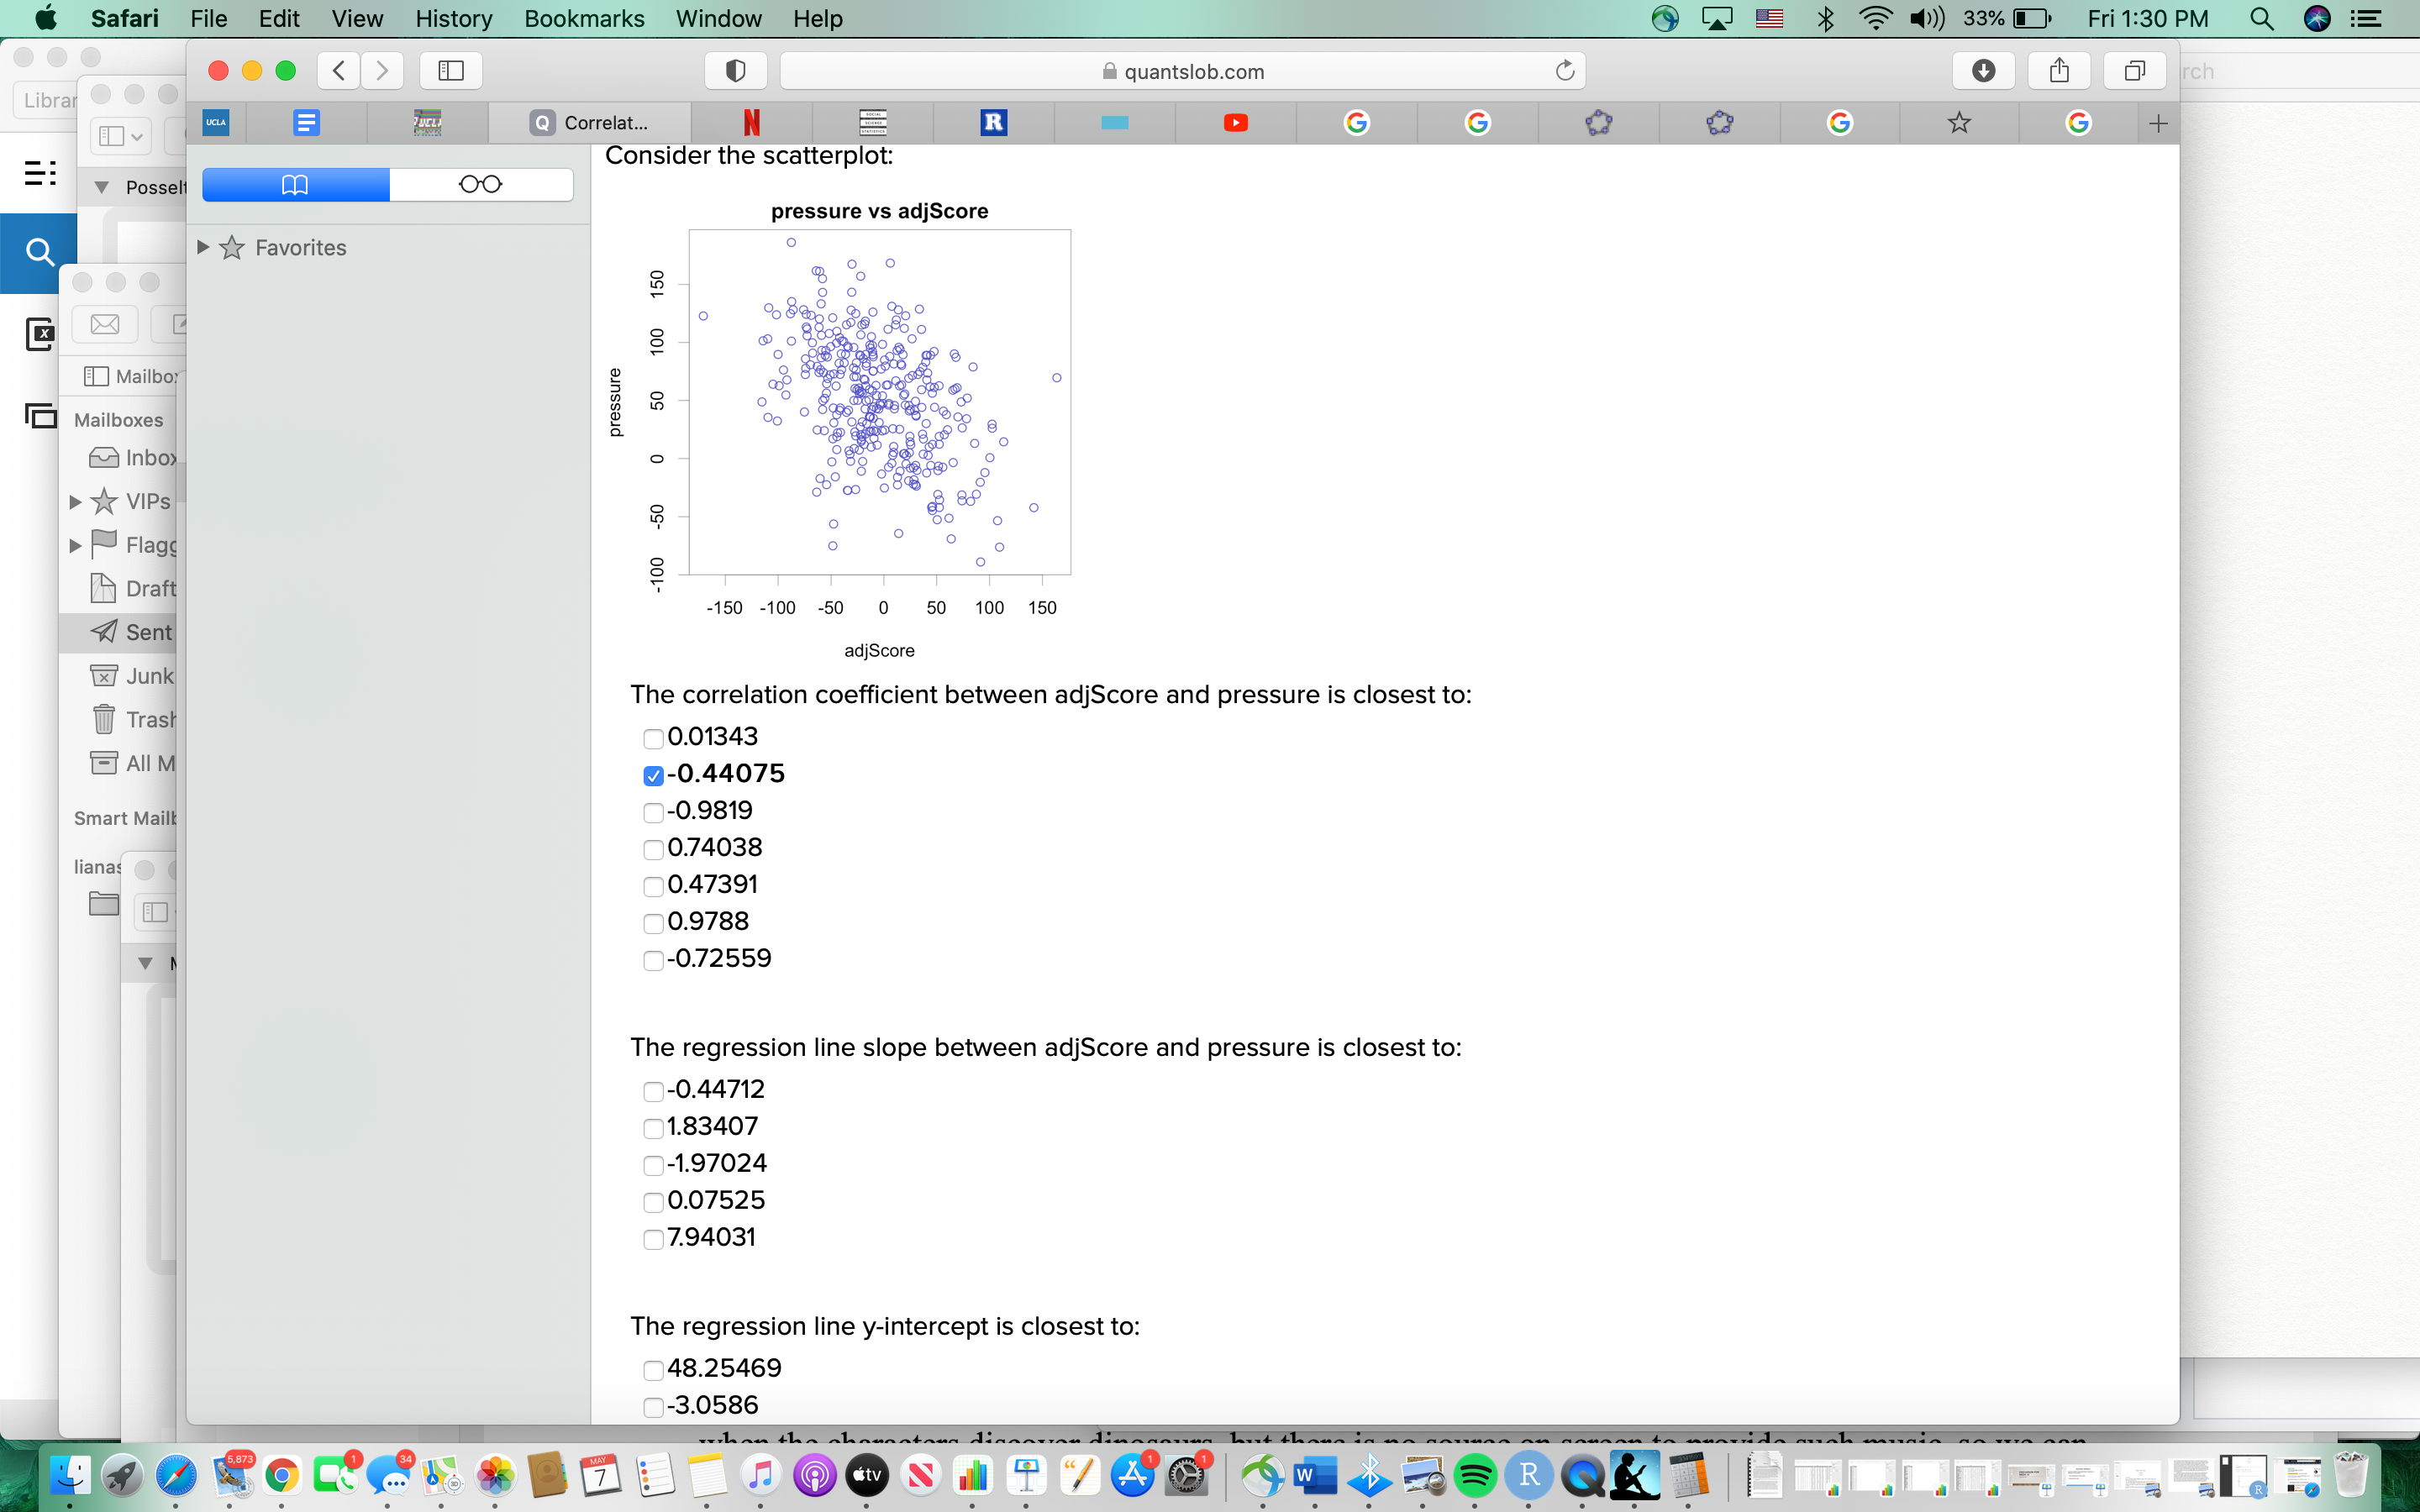
Safari File Edit View History Bookmarks Window Help ONEXT ) 33% Fri 1:30 PM Q DE . . . quantslob.com C + Libraro rch UCLA E Q Correlat.. R G G G G + Consider the scatterplot: Posself oo pressure vs adjScore Favorites O 150 Doo 8 808 100 O Mailbor O 50 pressure Mailboxes Inbox O O W VIPS O -50 O O Flags O O -100 Draft -150 -100 -50 0 50 100 150 Sent adjScore x Junk The correlation coefficient between adjScore and pressure is closest to: Trash 0.01343 AIM 0-0.44075 Smart Mailk 0-0.9819 00.74038 lianas 00.47391 00.9788 0-0.72559 The regression line slope between adjScore and pressure is closest to: 0-0.44712 01.83407 0-1.97024 00.07525 7.94031 The regression line y-intercept is closest to: 048.25469 -3.0586 7
Step by Step Solution
There are 3 Steps involved in it

Get step-by-step solutions from verified subject matter experts