

Question: Could you please me with the best possible answer looking at the graph? 3. Invoice Total Trend in 2021 $10.00M $9.00M $8.00M $7.00M $6.00M Invoice
Could you please me with the best possible answer looking at the graph?
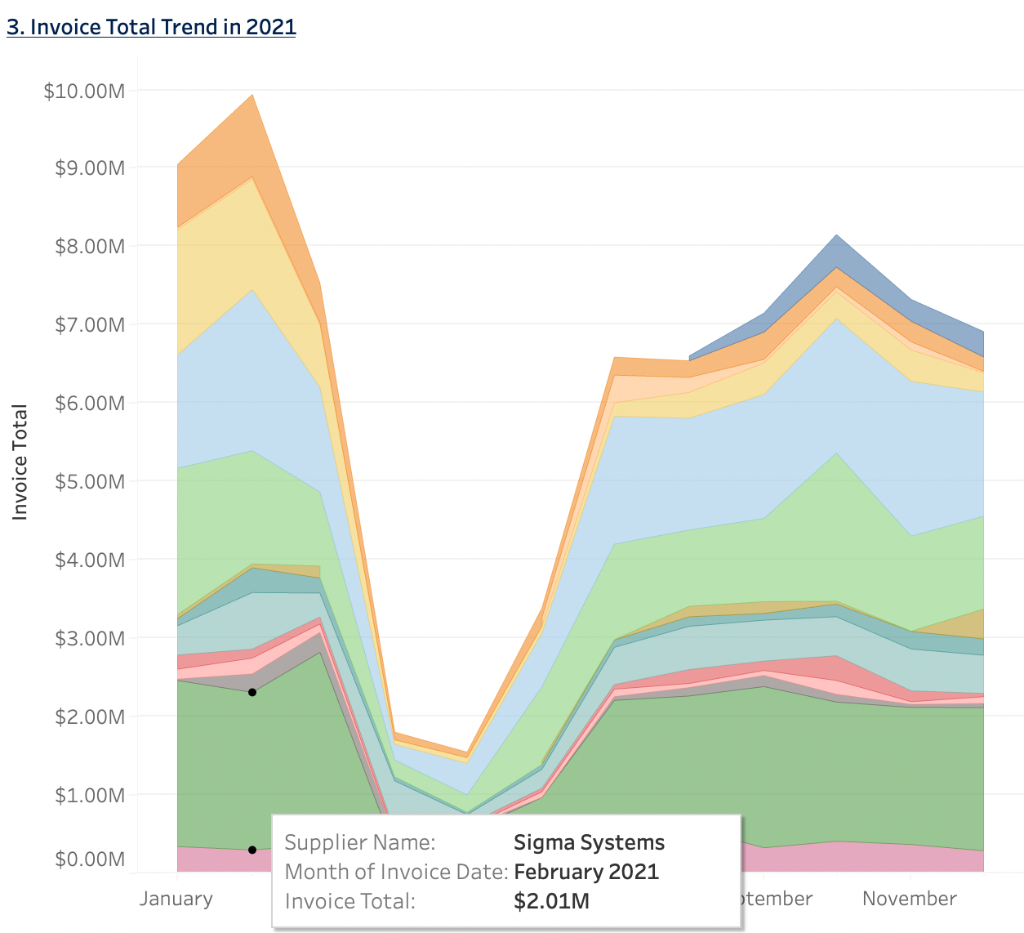

3. Invoice Total Trend in 2021 $10.00M $9.00M $8.00M $7.00M $6.00M Invoice Total $5.00M $4.00M $3.00M $2.00M $1.00M $0.00M Supplier Name: Sigma Systems Month of Invoice Date: February 2021 Invoice Total: $2.01M January otember November Invoice Total Trend in 2021 - This is a stacked area chart showing the invoice totals by supplier for each month. What trends are being shown on the Invoice Total Trend in 2021 visualization? O Monthly invoice totals were the highest at the end of the year and the lowest at the beginning of the year. Monthly invoice totals fluctuated inconsistently throughout the year. O Monthly invoice totals for Orange USA and York Marketing were distributed evenly throughout the year. O Monthly invoice totals for Hammond and Sigma Systems were distributed evenly throughout the year
Step by Step Solution
There are 3 Steps involved in it

Get step-by-step solutions from verified subject matter experts