

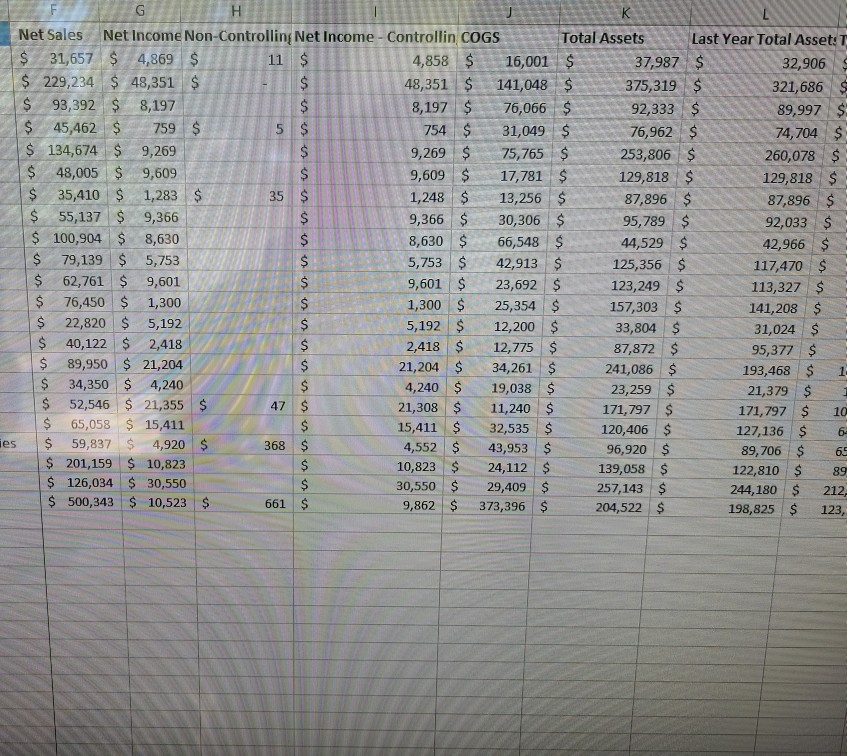
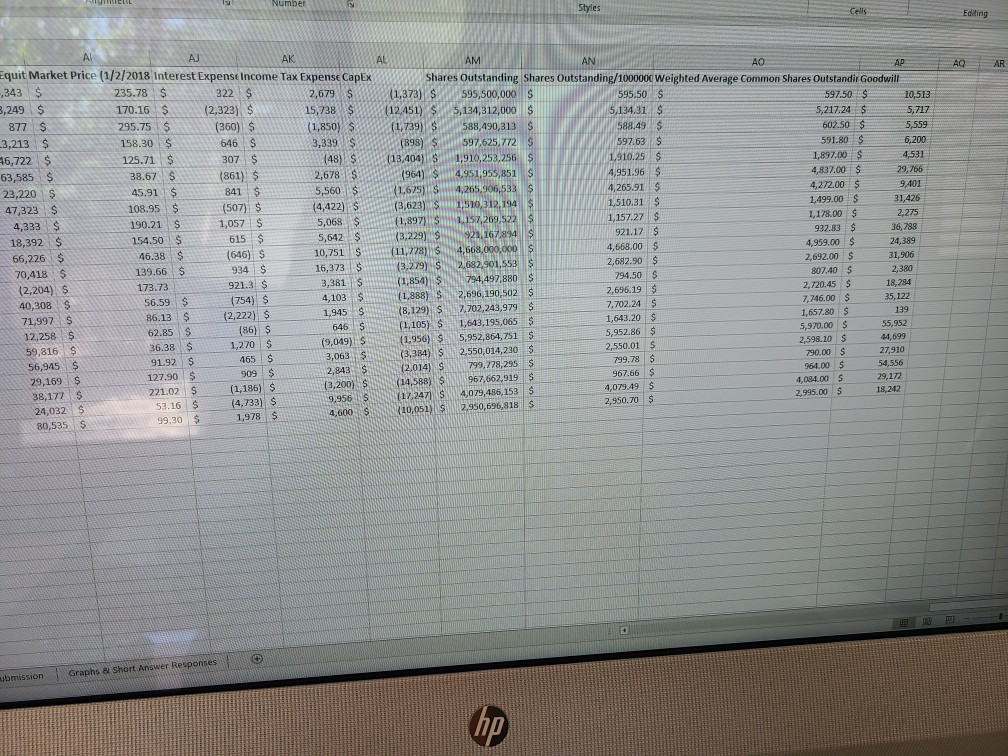
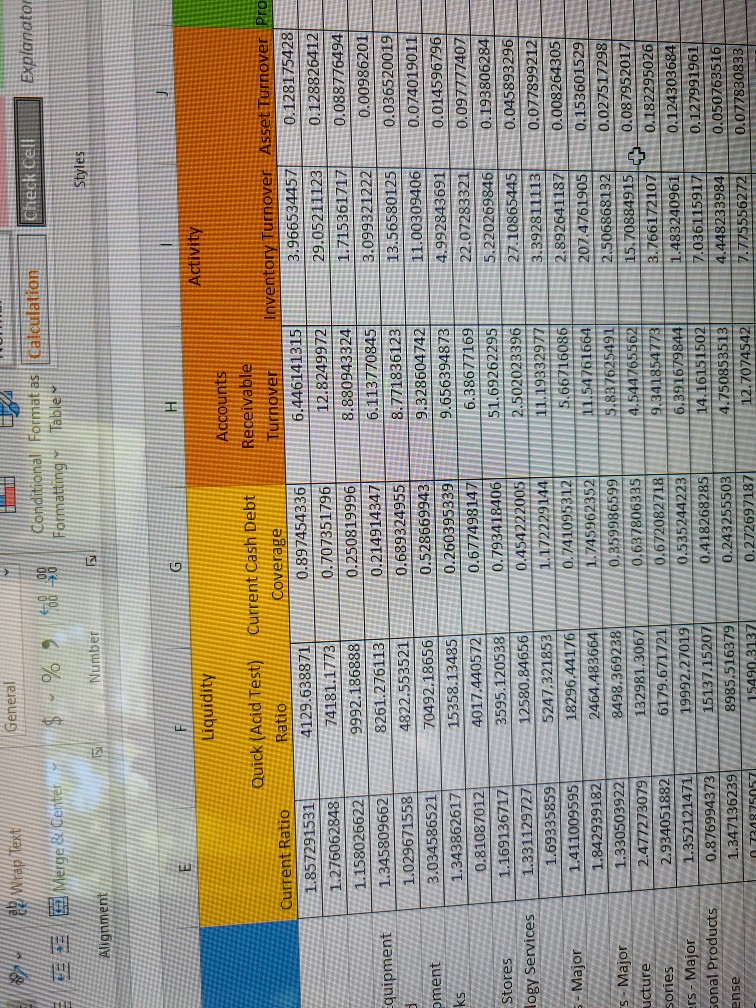
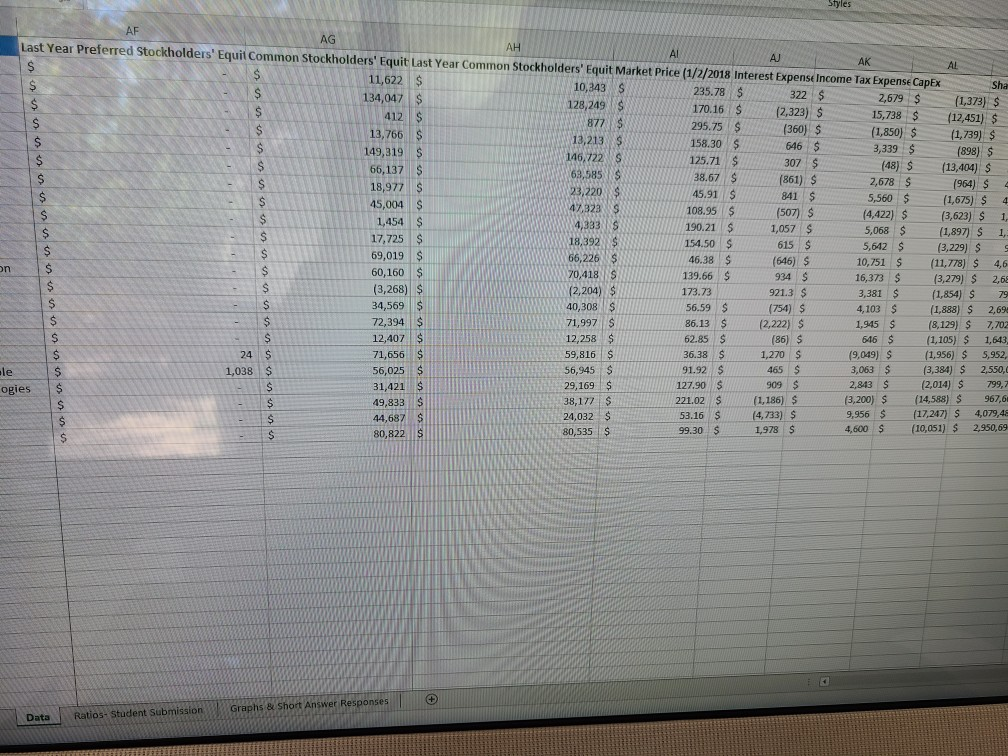
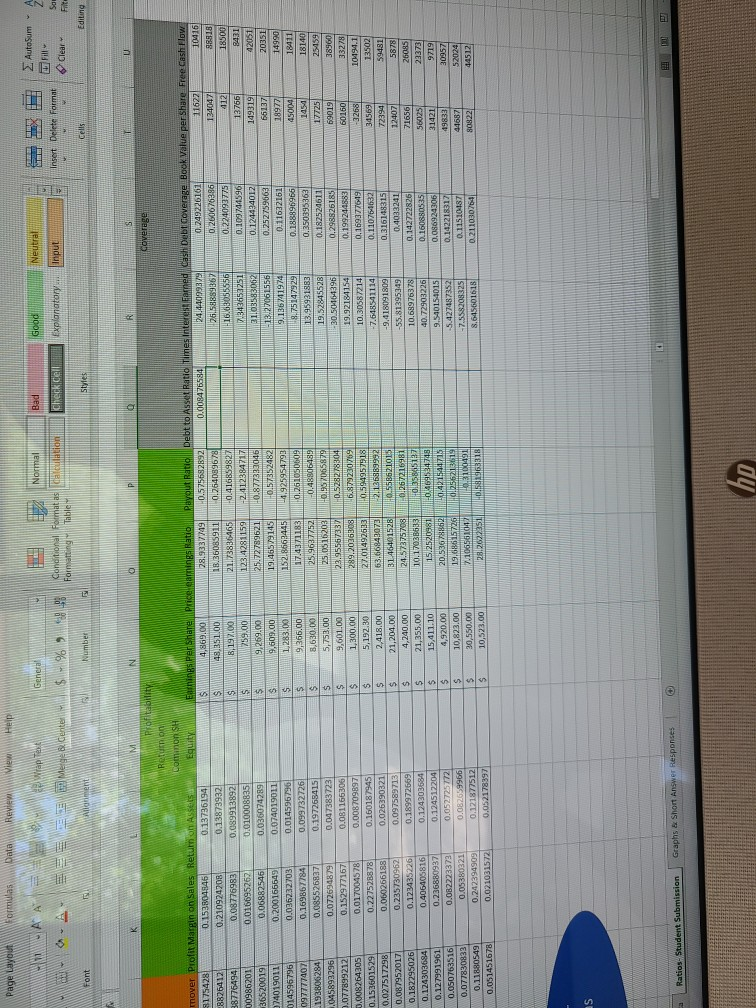
Question: could you please provide formulas to verify that I'm plugging in correctly. thank you $ G H K Net Sales Net Income Non-Controlling Net Income
could you please provide formulas to verify that I'm plugging in correctly. thank you
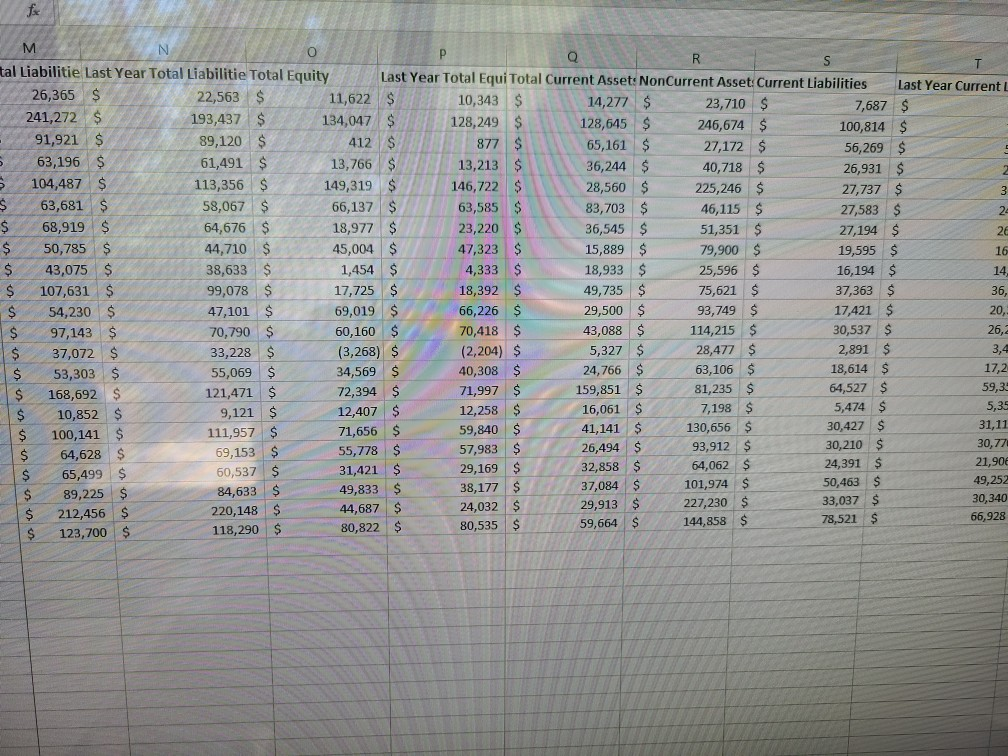
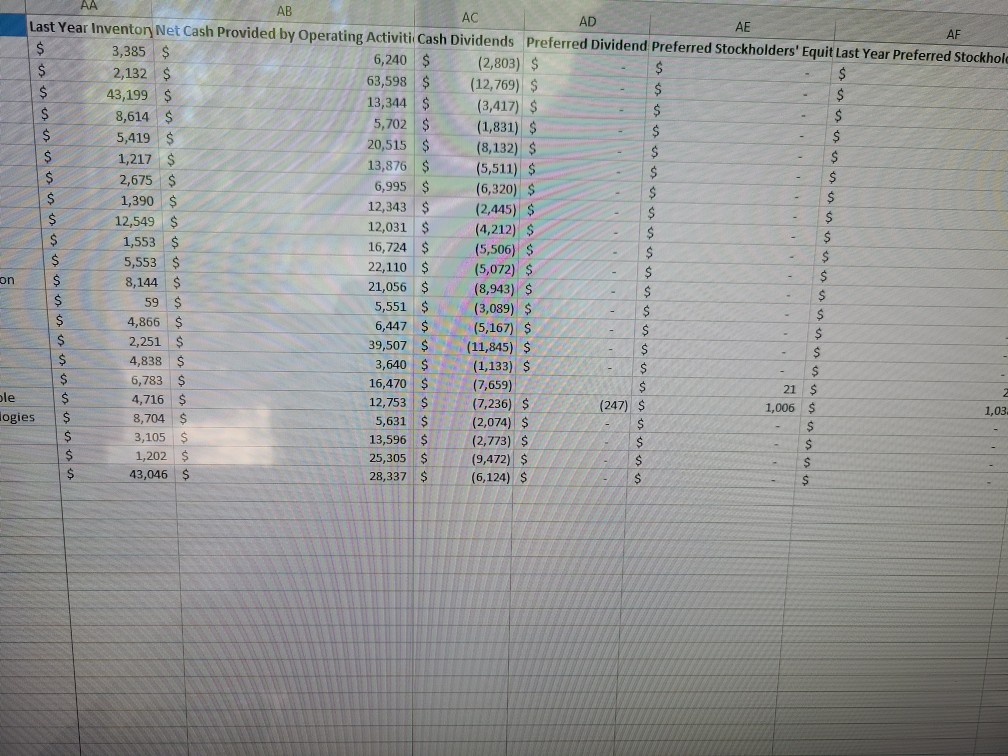
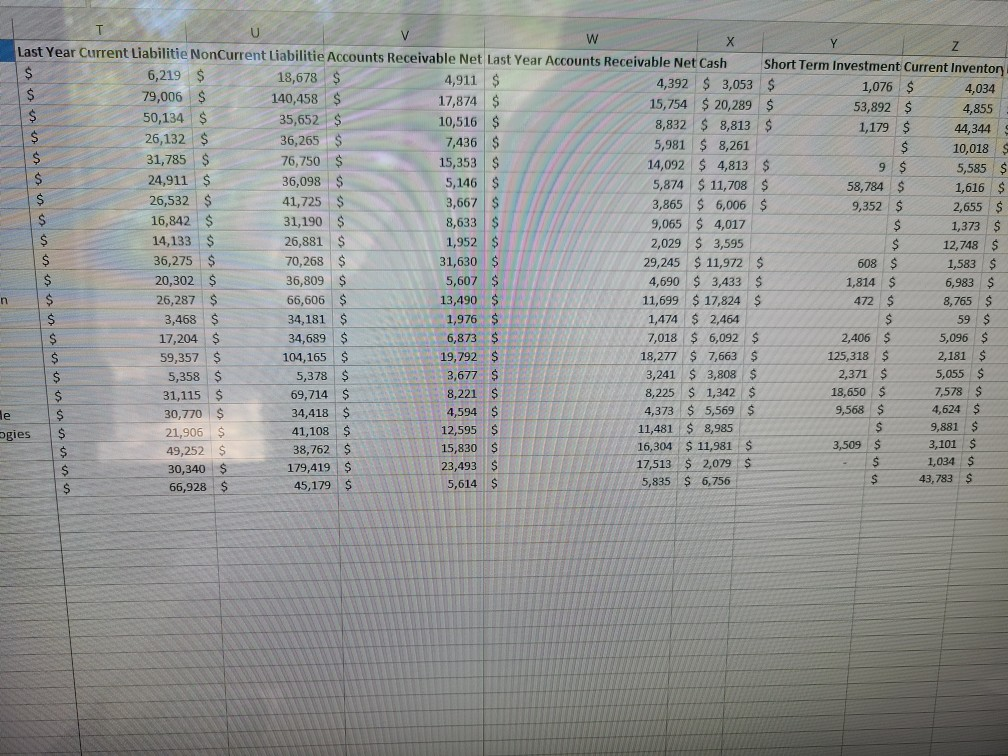
$ G H K Net Sales Net Income Non-Controlling Net Income - Controllin COGS Total Assets Last Year Total Asset: $ 31,657 $ 4,869 $ 11 4,858 $ 16,001 $ 37,987 $ 32,906 $ 229,234 $ 48,351 $ $ 48,351 $ 141,048 $ 375,319 $ 321,686 $ $ 93,392 $ 8,197 $ 8,197 $ 76,066 $ 92,333 $ 89,997 $ $ 45,462 $ 759 $ 5 $ 754 $ 31,049 $ 76,962 $ 74,704 $ $ 134,674 $ 9,269 $ 9,269 $ 75,765 $ 253,806 $ 260,078 $ $ 48,005 $ 9,609 $ 9,609 $ 17,781 $ 129,818 $ 129,818 $ $ 35,410 $ 1,283 $ 35 $ 1,248 $ 13,256 $ 87,896 $ 87,896 $ $ 55,137 $ 9,366 $ 9,366 $ 30,306 $ 95,789 $ 92,033 $ $ 100,904 $ 8,630 $ 8,630 $ 66,548 $ 44,529 $ 42,966 $ $ 79,139 $ 5,753 $ 5,753 $ 42,913 $ 125,356 $ 117,470 $ $ 62,761 $ 9,601 $ 9,601 $ 23,692 $ 123,249 $ 113,327 $ $ 76,450 $ 1,300 $ 1,300 $ 25,354 $ 157,303 $ 141,208 $ $ 22,820 $ 5,192 $ 5,192 $ 12,200 $ 33,804 $ 31,024 $ 40,122 $ 2,418 $ 2,418 $ 12,775 $ 87,872 $ 95,377 $ $ 89,950 $ 21,204 $ 21,204 $ 34,261 $ 241,086 $ 193,468 $ 1 $ 34,350 $ 4,240 $ 4,240 $ 19,038 $ 23,259 $ 21,379 $ $ 52,546 $ 21,355 $ 47 $ 21,308 $ 11,240 $ 171,797 $ 171,797 $ 10 $ 65,058 $ 15,411 $ 15,411 $ 32,535 $ 120,406 $ 127,136 $ 6 ies $ 59,837 $ 4,920 $ 368 $ 4,552 $ 43,953 $ 96,920 $ 89,706 $ 65 $ 201,159 $ 10,823 $ 10,823 $ 24,112 $ 139,058 $ 122,810 $ 89 $ 126,034 $ 30,550 $ 30,550 $ 29,409 $ 257,143 $ 244,180 $ 212 $ 500,343 $ 10,523 $ 661 $ 9,862 $ 373,396 $ 204,522 $ 198,825 $ 123, is UD M N O P Q tal Liabilitie Last Year Total Liabilitie Total Equity R S T Last Year Total Equi Total Current Asset: NonCurrent Asset: Current Liabilities 26,365 $ 22,563 $ Last Year Current L 11,622 $ 10,343 $ 14,277 $ 241,272 $ 23,710 $ 193,437 $ 7,687 $ 134,047 $ 128,249 $ 128,645 S 91,921 $ 246,674 $ 89,120 $ 100,814 $ 412 $ 877 $ 65,161 $ 63,196 $ 27,172 $ 61,491 S 56,269 $ 13,766 $ 13,213 $ 36,244 $ 40,718 $ 104,487 $ 113,356 $ 26,931 $ 2 149,319 $ 146,722 $ 28,560 $ 225,246 $ $ 27,737 $ 63,681 $ 58,067 $ 3 66,137 $ 63,585 $ 83,703 $ 46,115 $ 27,583 $ $ 68,919 $ 24 64,676 $ 18,977 $ 23,220 $ 36,545 $ 51,351 $ 27,194 $ 2 $ 50,785 $ 44,710 $ 45,004 $ 47,323 $ 15,889 $ 79,900 $ 19,595 $ 16 $ 43,075 $ 38,633 $ 1,454 $ 4,333 $ 18,933 $ 25,596 $ 16,194 $ 14 $ 107,631 $ 99,078 $ 17,725 $ 18,392 $ 49,735 $ 75,621 $ 37,363 $ 36, $ 54,230 $ 47,101 $ 69,019 $ 66,226 $ 29,500 $ 93,749 $ 17,421 $ 20, $ 97,143 $ 70,790 $ 60,160 $ 70,418 $ 43,088 $ 114,215 $ 30,537 $ 26, $ 37,072 $ 33,228 $ (3,268) $ (2,204) $ 5,327 $ 28,477 $ 2,891 $ 3,4 $ 53,303 $ 55,069 $ 34,569 $ 40,308 $ 24,766 $ 63,106 $ 18,614 $ 17,2 $ 168,692 $ 121,471 $ 72,394 $ 71,997 $ 159,851 $ 81,235 $ 64,527 $ 59,3 $ 10,852 $ 9,121 $ 12,407 $ 12,258 $ 16,061 $ 7,198 $ 5,474 $ 5,35 $ 100,141 $ 111,957 $ 71,656 $ 59,840 $ 41,141 $ 130,656 $ 30,427 $ 31,11 $ 64,628 $ 69,153 $ 55,778 $ 57,983 $ 26,494 $ 93,912 $ 30,210 $ 30,771 $ 65,499 $ 60,537 $ 31,421 $ 29,169 $ 32,858 $ 64,062 $ 24,391 $ 21,90 89,225 $ 84,633 $ 49,833 $ 38,177 $ 37,084 $ 101,974 $ 50,463 $ 49,252 $ 212,456 $ 220,148 $ 44,687 $ 24,032 $ 29,913 $ 227,230 $ 33,037 $ 30,340 $ 123,700 $ 118,290 $ 80,822 $ 80,535 $ 59,664 $ 66,928 144,858 $ 78,521 $ $ $ $ AA AB AC AD Last Year Inventory Net Cash Provided by Operating Activiti Cash Dividends Preferred Dividend Preferred Stockholders' Equit Last Year Preferred Stockhole AE AF $ 3,385 $ 6,240 $ $ (2,803) $ $ 2,132 $ 63,598 $ (12,769) $ $ 43,199 $ $ 13,344 $ (3,417) $ $ 8,614 S $ 5,702 $ (1,831) $ $ $ 5,419 $ $ 20,515 $ (8,132) $ $ $ 1,217 $ $ 13,876 $ (5,511) $ $ $ 2,675 $ $ 6,995 $ (6,320) $ $ $ 1,390 $ $ 12,343 $ (2,445) $ $ $ 12,549 $ $ 12,031 $ (4,212) $ $ $ 1,553 $ 16,724 $ (5,506) $ $ $ 5,553 $ $ 22,110 $ (5,072) $ $ on $ $ 8,144 $ 21,056 $ (8,943) $ $ $ $ 59 $ 5,551 $ (3,089) $ $ $ $ 4,866 $ 6,447 $ (5,167) $ $ $ $ 2,251 S 39,507 $ (11,845) $ $ $ 4,838 $ 3,640 $ (1,133) $ $ $ $ 6,783 $ 16,470 $ (7,659) $ 21 $ ple $ 4,716 $ 12,753 $ (7,236) $ (247) $ 1,006 $ 1,03 logies $ 8,704 S 5,631 S (2,074) $ $ $ 3,105 $ 13,596 $ (2,773) $ $ $ $ 1,202 $ 25,305 $ (9,472) $ $ $ $ 43,046 $ 28,337 $ (6,124) $ $ $ $ - $ S $ $ $ $ W Last Year Current Liabilitie NonCurrent Liabilitie Accounts Receivable Net Last Year Accounts Receivable Net Cash Y $ 6,219 $ Short Term Investment Current Inventory 18,678 $ 4,911 $ 4,392 $ 3,053 $ $ 79,006 $ 1,076 $ 140,458 $ 4,034 17,874 $ 15,754 $ 20,289 $ $ 50,134 S 35,652 $ 53,892 $ 4,855 10,516 $ 8,832 $ 8,813 $ 1,179 $ 26,132 $ 36,265 $ 44,344 7,436 $ 5,981 $ 8,261 $ 31,785 $ 10,018 $ 76,750 $ 15,353 $ 14,092 $ 4,813 $ 9 $ 24,911 $ 5,585 $ 36,098 $ 5,146 $ 5,874 $ 11,708 $ 58,784 $ 26,532 $ 1,616 $ 41,725 $ 3,667 $ 3,865 $ 6,006 $ 9,352 $ $ 2,655 $ 16,842 S 31,190 $ 8,633 $ 9,065 $ 4,017 $ $ 1,373 $ 14,133 $ 26,881 $ 1,952 $ 2,029 $ 3,595 $ 12,748 $ $ 36,275 $ 70,268 $ 31,630 $ 29,245 $ 11,972 $ 608 $ 1,583 $ 20,302 $ 36,809 $ 5,607 $ 4,690 $ 3,433 $ 1,814 $ 6,983 $ n $ 26,287 $ 66,606 $ 13,490 $ 11,699 $ 17,824 $ 472 $ 8,765 $ $ 3,468 $ 34,181 $ 1,976 $ 1,474 $ 2,464 $ 59 $ $ 17,204 $ 34,689 $ 6,873 $ 7,018 $ 6,092 $ 2,406 $ 5,096 $ $ 59,357 $ 104,165 $ 19,792 $ 18,277 $ 7,663 $ 125,318 S 2,181 $ $ 5,358 $ 5,378 $ 3,677 $ 3,241 $ 3,808 $ 2,371 $ 5,055 $ $ 31,115 $ 69,714 $ 8,221 $ 8,225 $ 1,342 $ 18,650 $ 7,578 $ $ 30,770 $ 34,418 $ 4,594 $ 4,373 $ 5,569 $ 9,568 $ 4,624 $ ogies $ 21,906 $ 41,108 $ 12,595 S 11,481 $ 8,985 S 9,881 $ $ 49,252 $ 38,762 $ 15,830 $ 16,304 $ 11,981 $ 3,509 $ 3,101 $ $ 30,340 $ 179,419 $ 23,493 $ 17,513 $ 2,079 $ $ 1,034 $ $ 66,928 S 45,179 $ 5,614 $ 5,835 $ 6,756 $ 43,783 $ $ le CE Styles Editing AQ AR 597,625,772 $ Number Cells AI AN AK AL AM Equit Market Price (1/2/2018 Interest Expense Income Tax Expense Capex AN AO AP ,343 $ Shares Outstanding Shares Outstanding/1000000 Weighted Average Common Shares Outstandir Goodwill 235.78 $ 322 S 2,679 $ (1,373) $ 595,500,000 $ 3,249 $ 170.16 S 595.50 $ (2,323) $ 15,738 S 597.50 $ (12.451) $ 10,513 5,134,312,000 $ 877 $ 5,134.31 $ 295.75$ (360) $ 5,217.24 $ (1,850) $ 5,717 (1,739) $ 588,490,313 S 588.49 $ -3,213 $ 158.30 $ 602.50 $ 646 $ 3,339 $ 5,559 (898) $ 597.63 $ 46,722 $ 125.71 $ 591.80 $ 307 $ 6,200 (48) (13,404) S 1,910,253,256 S 1,910.25$ 63,585 $ 1,897.00 $ 4,531 38.67 $ (861) $ 2,678 $ (964) $ 4.951,955,851 S 4,951.96 $ 4,837.00 $ 29,766 23,220 $ 45.91 $ 041 841 $ 5,560 $ (1,675)S 4,265,906,533 $ 4,265.91 S wel 4,272.00 $ 9,401 108.95 47,323 $ 108.95 (507) $ (4,422) $ (3,623) 1,510,312,194 $ 1,510.31 $ 1,499.00 $ 31,426 4,333 $ 190.21 $ 1,057 S 5,068 $ (1,897) 1. 157,269,522 $ 1,157.27 S 1,178.00 $ 2,275 18,392 $ 154.50 154.50 615 $ 5,642 $ (3,229) $ 921,167.894 $ 921.17 $ 932.83 S 36,788 66,226 $ 46.38 $ (646) $ 10,751 $ (11,278) $ 4,668,000,000 $ 4,668.00 $ 4,959.00 $ 24,389 70,418$ 139.66 $ 934 $ 16,373 $ 13,279) $ 2.682,901,553 $ 2,682.90 $ 2,692.00 $ 31,906 (2,204) $ 173.73 921.3 $ 3,381 S (1,854) $ 794,497,880 $ 294.50 $ 807.40 S 2,380 13.78 40,308 $ 56.59 $ 4,103 $ (1,888) 2,696,190,502 $ 2,696.19 $ 2,720.45 $ 18,284 71,997 $ 86.13 $ 1,945 $ (2,222) $ (8,129) $ 7.702,243,979 $ 7,746.00 S 7,702.24 $ 35,122 62.85 s 12,258 $ 646 $ (86) $ 139 1,643,195,065 $ (1.105) $ 1,657.80 $ 1,643.20 $ (9,049) 36.38 $ 59,816 $ 5,970.00 S 11,956) $ 1,270 $ 55,952 5,952.86 $ 5,952,864,751 S 44,699 91.92 $ 2,598.10 $ 3,063 S 465 2.550,014,230 $ $ 56,945 $ 2,550.01$ (3,384) $ 790.00 $ 27,910 909 799.78 $ 799.278,295 $ 2,843 $ (2014) $ 127.90 $ $ S 29,169 964.00 5 967,662,919 54,556 967.66 S (3,200) S $ (14,588) $ 221.02 $ (1,186) $ 38,177 $ 29,172 4,034.00 S 9,956 53.16 $ 4,079.49 $ S 4,079,486,153 S (17,247 S (4,733) $ 24,032 S 18,242 2.995.00 $ 2,950.70 $ 4,600 $ 99.30 $ (10,051) 1,978 $ 2,950,696,818 S 80,535 $ (754) $ ubmission Graphs & Short Answer Responses hp General ele Wrap Text EE E Merge dl Center as Calculation Check Cell Explanator Conditional Formatting Styles Number Alignment F G Liquidity Quick (Acid Testy Current Cash Debt Current Ratio Ratio Coverage 1.857291531 4129.638871 0.8974543361 1.276062848 74181.17731 0.707351796 1.158026622 9992.186888 0.2508199961 Equipment 1.345809662 8261.276113 0.214914347 1.029671558 4822.553521 0.689324955 oment 3.034586521 0.528669943 70492.18656 1.343862617 ks 15358.13485 0.260395339 0.81087012 4017.440572 0.6774981471 Stores 1.169136717 3595.120538 0.793418406 logy Services 1.331129727 12580.84656 0.454222005 1.69335859 5247.321853 1.1722291441 5- Major 1.411009595 18296.441761 0.741095312 1.842939182 2464.483664 1.745962352 S - Major 1.330503922 8498,369238 0.359986599 2.477273079 ucture 132981.30671 0.637806335 sories 2.934051882 6179.671721 0.672082718 ers - Major 1.352121471 19992.27019 0.5352442231 Sonal Products 0.876994373 15137.15207 0.418268285 ense 1.347136239 8985.516379 0.243255503 7348750571 15490.31371 0.272697187 H Activity Accounts Receivable Turnove Inve tory Turnover Asset Turnover Pro 6.446141315 3.9665344571 0.128175428 12.8249972 29.05211123 0.128826412 8.880943324 1.7153617171 0.088776494 6.113770845 3.0993212221 0.00986201 8.771836123 13.56580125 0.036520019 9.328604742 11.00309406 0.074019011 9.656394873 4.992843691 0.014596796 6.38677169 22.07283321 0.0977774071 51.69262295 5.220269846 0.193806284 2.502023396 27.10865445 0.045893296 11.193329771 3.392811113 0.077899212 5.66716086 2.892641187 0.008264305 11.54761664 207.4761905 0.153601529 5.837625491 2.506868132 0.027517298 4.544765562 15.70884915 0.087952017 TEL 9.341854773 3.7661721071 0.182295026 6.391679844 1.483240961 0.124303684 14.16151502 7.036115917 0.127991961 4.750858513 4.448233984 0.050763516 12.7074542 7.775556272 0.077830833 DETTE TRE RE Styles (360) $ 63,585 $ 4 45.91 $ (4,422) s (3,623) s AF AG Last Year Preferred Stockholders' Equit Common Stockholders' Equit Last Year Common Stockholders' Equit Market Price (1/2/2018 Interest Expense Income Tax Expense Capex AH AI AJ $ AK AL $ $ 11,622 $ 10,343 S Sha $ 235.78 S $ 322 $ 134,047 $ 128,249 $ 2,679 $ S 170.16 $ (1,373) $ 412 $ (2,323) $ $ 877 $ 15,738 $ (12,451) $ $ 295.75 S 13,766 S $ 13,213 $ (1,850) $ (1,739) $ $ 158.30 $ 149,319 $ 646 $ 3,339 $ $ 146,722 (898) $ S 125.71 $ 307 $ 66,137 $ (48) $ (13,404) $ $ $ 38.67 $ (861) $ 18,977 S 2,678 S (964) $ 23,220 $ $ $ 841 $ 45,004 S 5,560 $ (1,675) $ 47,328 $ 4 $ 108.95 $ (507) $ $ 1 1,454 S 4,333 $ 1 $ 190.21 $ 1,057 S $ 5,068 $ 17,725 $ (1,897) S 18,392 $ www 154.50 S $ 615 $ 5,642 $ 69,019 $ 2012 (3,229) $ $ 46.38 S on $ (646) $ Www 10,751 $ (11,778) $ 60,160 $ Is 4,6 70,418 139.66 $ 934 $ $ 16,373 $ (3,279) $ 2,68 S (3,268) $ (2,204) $ 173.73 921.3 S 3,381 $ $ 2460 (1,854) S 79 S 34,569 $ 40,308 $ 56.59 $ (754) S 4,103 S (1,888) $ 2,69 $ $ 72,394 $ 71,997 S 86.13 S (2,222) S 1,945 S (8,129) $ 7,702 $ 12,407 $ 12,258 $ 62.85 $ (86) $ 646 $ (1,105) S 1,643 $ 24 $ 71,656 $ 59,816 $ 36.38 $ 1,270 S (9,049) S (1,956) S 5,952 le $ 1,038 $ 56,025 56,945 $ 91.92 $ 465 3,063 $ (3,384) $ 2,550,0 20160 ogies $ S 31,421 $ 29,169 $ 127.90 $ 909 $ 2,843 $ (2014) S 799,7 $ $ 49,833 S 38,177 $ 221.02 S (1,186) $ (3,200) $ (14,588) $ 967,6 $ $ 44,687 $ 24,032 S 53.16 S (4,733) $ 9,956 $ (17,247) S 4,079,48 80,822 $ 80,535 S 99.30 S $ 1,978 $ $ (10,051) S 4,500 $ 2,950,69 1, $ 66,226 $ S $ $ $ + Graphs & Short Answer Responses Data Ratios. Student Submission HOME Page Layout Formulas Data We View Help DIE MAA wrap Test General Bad Normal Conditional Format as calculation Formatting Table Good Explanatory... Neutral Input 2 AutoSum A SOL Clear EE E MBCenter Insert Delete Format Check Cell $ % Font Woment WA Number Styles Cells Editing M NI Q R SP ofitability coverage WR. Comino SH mover Profit Margin on Sales Retum on AS Beshare. Paceng Ratio Payout Ratio Debt to Asset Ratio Times Interest Femed Cash Debt Coverage Book Value per Share Free Cash Flow 2175428 0.153804846 0.13736194 IS 4,869.00 78.9337749 0.575682892 0.008476584 24.44029379 0.249226161 11622 10416 8826412 0.210924708 0.13873932 $ 48.351.00 18.36085911 0.264099678 26.58889367 0.260676386 1340471 88918 88776494 0.08776983 0.089913892 S 5.192.00 21.73836465 -0.416859827 16.63055556 0.2240937751 1121 18500 00986200 0.0166952621 0.010008835 SI 259.00 123.4281159 2.412384717 .343652251 0.109744596 137661 8431) 36520019 0.06882546 0.036074289 5 9,269.00 25.72789621 -0.877332046 31.03583002 0.1244434012 149319 42051) 74019011 0.200166649 0.074019011 SI 9.609.00 19.46579145 0.57352482 13.20061556 0.252759663 66137 20351 014596796 0.036212703 0.014596796 S 1.283.001 152.8662445 4.925954793 9.136741974. 0.11622161 18977 14990 0977774071 0.169867784 0.099732726 > 9,366,00 17.4371183 0.2610506091 8.751479291 0.188890966 45004 18411 193806284 0.085526837 0.197265415 8,630.00 $ 25.9627752 13.95931883 0.48806489 0.350395363 14541 18140 045893296 0.072694879 0.047383723 S 5,753.00 25.05.2031 0.25.2065879 19.528455281 0_182524611 17725 25.159 077899212 0.152977167 0.081166306 $ 9,601.00 23.95567337 0.528278304 30.50164396 0.298826185 690191 38960) 0.008264305 0.017004578 0.008709897 1,300.00 289.2036308 46.2292307692 19.92184154 0.199244883 60160 33278 0.152601529 0.227528878 0.160187945 S 5,192.30 27.014926331 0.594957918|| 10.30587214 0.169377619 3268 10194.1 0,027517298 0.000266188 0.026390321 2.418.00 63.66842073 7.648541114 34569 2.36889992 0.110766632 > 13502 0.087952017 0.235730962 0.097589713 $ 21,204.00 31.46401528 0.558621015 9,4180918091 0.316148315 72394 59481 0.182295026 0.123435226 4,240.00 0.189972669 21.5787208 0.2672162811 12407) 55.81395349 04033201 5878 0.124303684 0.124303684 0.406405816 21,355.00 10.170386331 0.142722826 013584512 $ 10.68976378 21656 26085 0.127991961 0.236880937 0.1245122041 15,411.10 15.2520981 40.72903226 0469534743 0.160880535 > 56025 233731 0.050763516 0.086924306 4,920.00 0.082223372 31421 20.53678862 0.052725772 9719 1.421544715 5 9.540154015 0.05380321 0.082659966 0.077830833 10,823.00 5.427487352 19.68615726 30957 0126213619 0.142218317 19883 $ 7.558208325 0.11880549 30,550.00 0.242394909 44687 7.106501042 0.121877512 52024 0.31004911 0.115101871 $ 0.051451678 0.211030764 10,523.00 0.021031572 80822 28.202225 0.052178397 44512 0.581963318 $ 8.645601618 IS Ratios. Student Submission Graphs & Short Answe Response hp
Step by Step Solution
There are 3 Steps involved in it

Get step-by-step solutions from verified subject matter experts