

Question: Could you please provide the R code Q3. We study the relation between weekly advertising expenditures and sales with the following data: Advertising costs($) 40
Could you please provide the R code
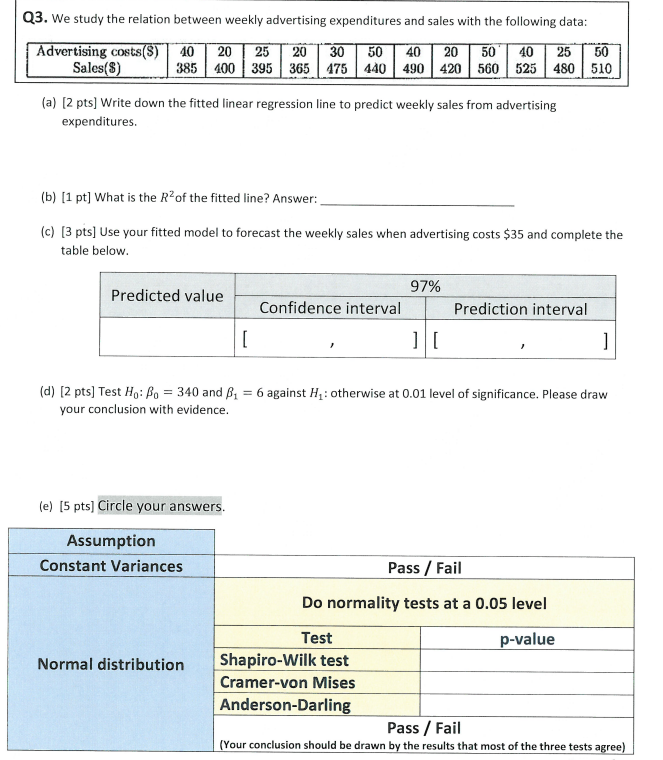
Q3. We study the relation between weekly advertising expenditures and sales with the following data: Advertising costs($) 40 20 25 20 30 50 40 20 50 40 25 50 Sales($) 385 100 395 365 475 440 490 420 560 525 480 510 (a) [2 pts] Write down the fitted linear regression line to predict weekly sales from advertising expenditures. (b) [1 pt] What is the R2of the fitted line? Answer: (c) [3 pts] Use your fitted model to forecast the weekly sales when advertising costs $35 and complete the table below. 97% Predicted value Confidence interval Prediction interval (d) [2 pts] Test Ho: So = 340 and 81 = 6 against H : otherwise at 0.01 level of significance. Please draw your conclusion with evidence. (e) [5 pts] Circle your answers. Assumption Constant Variances Pass / Fail Do normality tests at a 0.05 level Test p-value Normal distribution Shapiro-Wilk test Cramer-von Mises Anderson-Darling Pass / Fail (Your conclusion should be drawn by the results that most of the three tests agree)
Step by Step Solution
There are 3 Steps involved in it

Get step-by-step solutions from verified subject matter experts